Tag Archives: earnings-center

Best Performing Franklin Templeton Mutual Funds Of Q2 2015

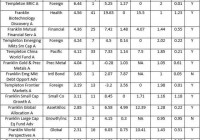
Franklin Resources, Inc. a global investment management organization known as Franklin Templeton Investments, reported fiscal third-quarter 2015 earnings of 82 cents per share which missed the Zacks Consensus Estimate by 5 cents. Moreover, the results compared unfavorably with the prior-year quarter earnings of 92 cents per share. Franklin Templeton is a leader in asset management with a presence in over 150 countries. As for the mutual funds, Franklin Templeton mutual funds put up a decent performance in a relatively tough second quarter. While markets found it difficult to post strong gains, the best gain coming from a Franklin Templeton mutual fund hit 6.5%. The best gain for a Franklin Templeton mutual fund lagged Fidelity’s best gain of 11.6% , scored by Fidelity China Region Fund (MUTF: FHKCX ). However, top gainer Templeton BRIC Fund (MUTF: TABRX ) did well to beat key peers like BlackRock (NYSE: BLK ), Vanguard and edged past the 6.2% gains for both American Funds and T. Rowe Price. Nonetheless, Of the 331 Franklin Templeton mutual funds under the study, 104 funds finished in the green. The average gain for these funds was nearly 1.7%. This also beats the average gains for the key peers. Of the funds finishing in the green in the second quarter, BlackRock, Vanguard, American Funds had average gains of 1.3%, 0.8% and 1.4%. Meanwhile, T. Rowe Price (NASDAQ: TROW ) funds ending in positive territory had break even return. In fact, Vanguard had a dismal second quarter and the best gain reached just 3.8%. Coming back to Franklin Templeton funds, the average loss for the 227 funds was 1.4%. Key Takeaways from Second Quarter In its U.S. Economic and Market Overview for Q2, Franklin Templeton has listed 4 key points. These are as follows: Although signs of U.S. economic reacceleration multiplied this spring, broad U.S. equity market indexes ended the second quarter of 2015 on a somewhat muted note. Global “easy money” stimulus measures expanded during the first half of 2015 nearly everywhere except in the United States. Consumer spending bounced back convincingly this spring following winter doldrums, aided not only by better weather but also by some signs of better wage growth, which have been supported by solid employment advances. The U.S. factory sector faced headwinds from the impact of the dollar’s rise and a mild contraction in export demand. To elaborate, Franklin Templeton notes that Greece’s debt crisis intensified volatility at the end of the quarter. Markets were also guided by divergent monetary policies in key regions like Europe, Asia and the U.S. U.S. profits dropped to the weakest year-over-year earnings growth in 11 quarters. Stimulus measures increased in most regions except the U.S. Franklin Templeton notes: “Having implemented unprecedented accommodative monetary policies since the financial crisis, Fed policymakers have indicated their intention to raise interest rates later this year if conditions warrant, and they appeared keen to avoid disrupting the country’s subdued economic growth amid weak productivity and the wavering confidence of businesses, consumers and investors”. Wage growth and employment improvements coupled with better weather conditions helped consumer spending rebound in the spring. In mid June, initial claims dropped to the lowest levels since 2007. The Conference Board’s Consumer Confidence Index had jumped over 100 in May. Meanwhile, housing data also came in positive. Top 15 Franklin Templeton Funds of the Second Quarter 2015 Below we present the top 15 Franklin Templeton funds with best returns of Q2 2015: (click to enlarge) Note: The list excludes the same funds with different classes, and institutional funds have been excluded. Funds having minimum initial investment above $5000 have been excluded. Q2 % Rank vs Objective* equals the percentage the fund falls among its peers. Here, 1 being the best and 99 being the worst. The top 15 gainers’ list is a mixture of funds from varied categories. Diversification is prevalent and we have funds from Foreign, Health, Financial, Intl Bond, Small Co,Growth/Inc and Technology. The Foreign category of mutual funds dominated the gains in the second quarter, as well as, the first half. Healthcare category has also been consistent in having strong gains. Financial and Small Growth categories were also featured in the top 10 list of gainers in the second quarter, according to Morningstar data.Funds from Foreign/Global/Pacific categories included Templeton BRIC A, the Templeton Emerging Markets Small Cap Fund (MUTF: TEMMX ), the Templeton China World Fund (MUTF: TCWAX ), the Templeton Frontier Markets Fund (MUTF: TFMAX ), the Templeton Institutional Fund Global Equity Series (MUTF: TGESX ), However, only TGESX carries a Zacks Mutual Fund Rank #2 (Buy) ; whereas TCWAX and TFMAX now hold a Zacks Mutual Fund Rank #5 (Strong Sell), and TABRX and TEMMX carry a Zacks Mutual Fund Rank #4 (Sell). The other funds include the Franklin Biotechnology Discovery Fund (MUTF: FBDIX ) from Health category and the Franklin Mutual Financial Services Fund (MUTF: TFSIX ) from the Financial category. Both of these funds carry a Zacks Mutual Fund Rank #2 (Buy). From the Small cap category, the Franklin Small Cap Growth Fund (MUTF: FSGRX ) and the Templeton Global Smaller Companies Fund (MUTF: TEMGX ) were the gainers. FSGRX holds a Zacks Mutual Fund Rank #4 and TEMGX carry a Zacks Mutual Fund Rank #3 (Hold). A surprise inclusion in the list is the Franklin Gold and Precious Metals Fund (MUTF: FKRCX ) from the Precious Metals category. In the second quarter, the category had dropped 2.3%. FKRCX carries a Zacks Mutual Fund Rank #1 (Strong Buy). The Franklin Large Cap Equity Fund (MUTF: FLCIX ) and the Franklin DynaTech Fund (MUTF: FKDNX ) are the only other funds carrying a Strong Buy rank. Link to the original post on Zacks.com

Best And Worst Q3’15: Materials ETFs, Mutual Funds And Key Holdings

Summary Materials sector ranks sixth in Q3’15. Based on an aggregation of ratings of 12 ETFs and 15 mutual funds. FMAT is our top-rated Materials ETF and FSCHX is our top-rated Materials mutual fund. The Materials sector ranks sixth out of the 10 sectors as detailed in our Q3’15 Sector Ratings for ETFs and Mutual Funds report. It gets our Neutral rating, which is based on an aggregation of ratings of 12 ETFs and 15 mutual funds in the Materials sector. See a recap of our Q2’15 Sector Ratings here. Figures 1 ranks all nine ETFs and Figure 2 ranks the five best and five worst mutual funds in the sector. Not all Materials sector ETFs and mutual funds are created the same. The number of holdings varies widely (from 27 to 139). This variation creates drastically different investment implications and, therefore, ratings. Investors seeking exposure to the Materials sector should buy one of the Attractive-or-better rated ETFs or mutual funds from Figures 1 and 2. Figure 1: ETFs with the Best & Worst Ratings – Top 5 (click to enlarge) * Best ETFs exclude ETFs with TNAs less than $100 million for inadequate liquidity. Sources: New Constructs, LLC and company filings The PowerShares DWA Basic Materials Momentum Portfolio ETF (NYSEARCA: PYZ ), the ProShares Ultra Basic Materials ETF (NYSEARCA: UYM ) and the Guggenheim S&P Equal Weight Materials ETF (NYSEARCA: RTM ) are excluded from Figure 1 because their total net assets are below $100 million and do not meet our liquidity minimums. Figure 2: Mutual Funds with the Best & Worst Ratings – Top 5 (click to enlarge) * Best mutual funds exclude funds with TNAs less than $100 million for inadequate liquidity. Sources: New Constructs, LLC and company filings The Fidelity MSCI Materials ETF (NYSEARCA: FMAT ) is the top-rated Materials ETF and the Fidelity Select Chemicals Portfolio (MUTF: FSCHX ) is the top-rated Materials mutual fund. FMAT earns a Neutral rating and FSCHX earns an Attractive rating. The iShares Goldman Sachs Natural Resources ETF (NYSEARCA: IGE ) is the worst-rated Materials ETF and the Rydex Series Basic Materials Fund (MUTF: RYBMX ) is the worst-rated Materials mutual fund. IGE earns a Neutral rating and RYBMX earns a Very Dangerous rating. 172 stocks of the 3000+ we cover are classified as Materials stocks. Compass Minerals International, Inc. (NYSE: CMP ) is one of our favorite stocks held by Materials ETFs and mutual funds and earns our Attractive rating. Since 2012, Compass Minerals has grown after-tax profit ( NOPAT ) by 18% compounded annually. The company’s return on invested capital ( ROIC ) has also improved the past three years and is currently a top-quintile 18%. In spite of Compass Minerals’ impressive fundamental performance, the stock remains undervalued. At its current price of ~$80/share, CMP has a price to economic book value ( PEBV ) ratio of 1.0. This ratio implies that the market expects NOPAT to never grow from its current level. However, if Compass Minerals can grow NOPAT by 6% compounded annually for the next six years , the stock is worth $104/share today – a 30% upside. Hecla Mining Company (NYSE: HL ) is one of our least favorite stocks held by Materials ETFs and mutual funds and earns our Very Dangerous rating. Since 2011, Hecla’s NOPAT has declined by 46% compounded annually while revenue has only grown by 1% compounded annually. Hecla’s bottom quintile ROIC of 1% is well below the 14% it earned in 2011 as well. Unfortunately for investors, despite the stock price being down 14% YTD, it remains overvalued. To justify its current price of ~$2/share, Hecla must grow NOPAT by 14% compounded annually for the next 21 years . Two decades of double digit profit growth is a hurdle for even the best of companies and even more so for one that hasn’t grown NOPAT over the past four years. Figures 3 and 4 show the rating landscape of all Materials ETFs and mutual funds. Figure 3: Separating the Best ETFs From the Worst ETFs (click to enlarge) Sources: New Constructs, LLC and company filings Figure 4: Separating the Best Mutual Funds From the Worst Mutual Funds (click to enlarge) Sources: New Constructs, LLC and company filings D isclosure: David Trainer, Kyle Guske II, and Max Lee receive no compensation to write about any specific stock, sector or theme. Disclosure: I/we have no positions in any stocks mentioned, and no plans to initiate any positions within the next 72 hours. (More…) I wrote this article myself, and it expresses my own opinions. I am not receiving compensation for it. I have no business relationship with any company whose stock is mentioned in this article.

Low Volatility And Momentum: Doubling The Market Return

Summary This series offers an expansive look at the Low Volatility Anomaly, or why lower risk stocks have historically produced stronger risk-adjusted returns than higher risk stocks or the broader market. While low volatility strategies are often an appropriate long-term buy-and-hold strategy, this article offers a strategy that uses a momentum signal to tilt towards higher-beta securities selectively. The alpha-generative strategy combines two market anomalies – Low Volatility and Momentum – to produce outsized returns. In recent articles, I have been authoring a fairly extensive examination of the Low Volatility Anomaly, the tendency for low volatility assets to outpeform high beta assets over long-time intervals. A Low Volatility strategy was one of five buy-and-hold factor tilts that I described in a previous series of articles. I believe that these buy-and-hold strategies to capture structural alpha are appropriate for many in the Seeking Alpha audience, but understand that some readers are looking for strategies that can generate even higher absolute returns. This article depicts one such strategy. Long-time readers know that two of favorite topics on which to author have been Low Volatility and Momentum strategies. This article combines these two strategies to produce a return profile that as the title of the article suggests has more than doubled the return of the S&P 500 over the past quarter-century. Before we delve into this strategy, we should first discuss the two components that drive this tremendous performance. Low Volatility Anomaly Regular readers know that I am currently authoring a multi-part series on the Low Volatility Anomaly. These articles include an introduction to the concept, a theoretical underpinning for the anomaly , cognitive and market structure factors that contribute to its long-run performance, and empirical evidence that demonstrates the outperformance of low volatility strategies across markets, geographies and long time intervals. In past articles, I have depicted the relative outperformance of Low Volatility strategies using the graph below which shows the cumulative total return profile (including reinvested dividends) of the S&P 500 (NYSEARCA: SPY ), the S&P 500 Low Volatility Index (NYSEARCA: SPLV ), and the S&P 500 High Beta Index (NYSEARCA: SPHB ) over the past twenty five years. The volatility-tilted indices are comprised of the one-hundred lowest (highest) volatility constituents of the S&P 500 based on daily price variability over the trailing one year, rebalanced quarterly, and weighted by inverse (direct) volatility. Source: Standard and Poor’s; Bloomberg The Low Volatility strategy contributes an important base component to this strategy that would have doubled the return of the market over the past twenty-five years, but we also need an element that pushes the strategy into riskier parts of the market when we can get paid for this tilt in the form of higher returns. Momentum Like the low volatility strategy, momentum strategies have been alpha-generative over long time intervals and across markets. Consistent with Jegadeesh and Titman (1993), which documented momentum in stock prices that have outperformed in the recent past over short forward intervals, the efficacy of momentum strategies have been widely documented. Academic literature has described excess returns generated by momentum strategies in foreign stocks ( Fama and French 2011 ), multiple asset classes ( Schleifer and Summers 1990 ), commodities ( Gorton, Hayashi and Rouwenhorst 2008 ), and my own studies on momentum in fixed income strategies and more recently the oil market . Academic literature offers competing theories on why momentum has generated alpha over long time intervals across markets and geographies. Proponents of market efficiency suggest that momentum is a unique risk premium, and the long-run profitability of these strategies is compensation for this unique systematic risk factor ( Carhart 1997 ). Behaviorists offer multiple competing explanations. In my previous series, I referenced both Lottery Preferences and Overconfidence as potential justifications. Studies contend that markets under-react to new information ( Hong and Stein 1999 ), which allows for the autocorrelations found in return series. Other behavioral economists contend that the disposition effect, or the tendency for investors to pocket gains and avoid losses, makes investors prone to sell winners early and hold onto losers too long ( Frazzini 2006 ), which could be further amplified by a “bandwagon effect” that leads investors to favor stocks with recent outperformance. Blitz, Falkenstein and Van Vliet (2013) offer an expansive summary of these explanations. The Strategy I am of the opinion that low volatility stocks should be a part of investors’ longer-term strategic asset allocation given that class of stocks’ historical higher average returns and lower variability of returns. In ” Making Buffett’s Alpha Your Own ,” I described academic research ( Frazzini, Kabiller, Pederson 2013 ) that broke down the Oracle of Omaha’s tremendous track record at Berkshire Hathaway ( BRK.A , BRK.B ) into two components – capturing the Low Volatility Anomaly and the application of leverage. If an allocation to low volatility stocks should be part of your long-term strategic asset allocation, then an allocation to high beta stocks must be done tactically with a short-term focus given that class of stocks’ lower long-run average returns and higher variability of returns. This view is borne out of the data underpinning the chart above. However, a temporary allocation to the High Beta Index in sharply rising markets can further boost performance. The High Beta stock index has typically outperformed in post-recession recoveries. How do we combine Low Volatility and Momentum? A quarterly switching strategy between the Low Volatility Index and the High Beta Index, which buys the leg that has outperformed over the trailing quarter and holds that leg forward for the subsequent quarter, would have produced the return profile seen below since 1990, easily besting the S&P 500 with lower return volatility. For a pictorial demonstration of the leg that would be chosen by the Momentum strategy, please see the exhibit at the end of the article. It is a very simple heuristic. The Momentum strategy buys either Low Vol or High Beta stocks based on the index that outperformed in the trailing quarter and holds that index for the subsequent quarter before re-examining the allocation once again. The results are striking. (click to enlarge) From the cumulative return graph above, one can see that $1 invested in the S&P 500 would have produced $9.04 at the end of the period (including reinvested dividends) whereas $1 invested in the Momentum portfolio would have produced $19.90. These are gross index returns and do not consider taxes. Readers envisioning employing momentum strategies should utilize tax-deferred accounts. Summary statistics of the trade are captured below: (click to enlarge) The simple quarterly switching momentum strategy would have produced a 13% return per annum over the long sample period. This 3.6% outperformance relative to the S&P 500 led to the cumulative doubling of the market returns over time. Note that while the Momentum strategy is riskier than the broad market as measured by the variability of quarterly returns, practitioners of this strategy would have been rewarded with correspondingly higher returns for this incremental risk. While I contend that a long-run, buy-and-hold tilt towards lower volatility equity is probably appropriate for many Seeking Alpha readers, this article demonstrates a momentum-based switching strategy that can help inform investors when to pivot towards higher beta stocks when they offer returns commensurate with their higher risk. Disclaimer My articles may contain statements and projections that are forward-looking in nature, and therefore inherently subject to numerous risks, uncertainties and assumptions. While my articles focus on generating long-term risk-adjusted returns, investment decisions necessarily involve the risk of loss of principal. Individual investor circumstances vary significantly, and information gleaned from my articles should be applied to your own unique investment situation, objectives, risk tolerance, and investment horizon. Exhibit: Returns of Low Vol, High Beta, Momentum, & Market (click to enlarge) Disclosure: I am/we are long SPLV, SPHB. (More…) I wrote this article myself, and it expresses my own opinions. I am not receiving compensation for it (other than from Seeking Alpha). I have no business relationship with any company whose stock is mentioned in this article.