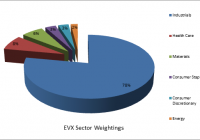
Proper waste management has been largely ignored by newly emerged economies. Legislation in advanced economies has necessitated the creation of a waste management industry. The Market Vectors ETF contains top-tier companies as well as very specialized waste management companies. Over the past twenty years or so, many nations discovered that socialist economic management, although noble in concept, was impractical in reality. Nations such as China, India, Russia, Eastern Europe and many South American nations pursued and adopted “free market principles” with great success. Literally millions upon millions have risen out of poverty and have attained a better standard of living. However, as so often happens in emerging markets, environmental sustainability took a back seat to economic development. The rapid industrial expansion may well have created a global “climate change”. It certainly has created dangerous levels of smog and air pollution in many of the world’s most famous cities. Several of the world’s great rivers have become polluted and nearly devoid of life. One critical problem that has hardly been addressed is the various kinds of solid waste; everything from industrial waste down to the trash generated, by each of us, every day. Van Eck Global offers investors a way to benefit from a niche market through its Market Vectors ETF Environmental Services ETF (NYSEARCA: EVX ) . The fund tracks the performance of the NYSE Arca Environmental Services Index (AXENV) : a modified equal dollar-weighted index intended to give investors exposure to the environmental services sector. A word of caution: This is a very thinly traded specialized fund so it may not be a suitable holding for all investors. However, it does contain well-known, well-established, dividend-paying companies. Hence, the questions are whether it’s worth holding the fund, or simply selecting individual companies. Since there are only 23 companies in the fund as of the first week of August 2015, it would be best to break the holdings down into their respective sectors and identify both strong and weak points. First, the fund is comprised almost entirely of US-based companies, 96.4%, and also a few Canadian holdings, 3.6%. This is an important point. Both governments have long established legislation on environmental issues, including the proper, safe and sustainable disposal of industrial and residential waste, for one example, the Ocean Dumping Ban Act of 1988 . Further, legislation is far from complete. Individual US states have their own requirements. The point being that there is a demand for the management of waste necessitated by laws and regulations. Further, laws, regulations, certifications, permits, specialized equipments and procedures are required to collect, transport and dispose of medical waste. A quick examination of the top ten holdings demonstrates the general waste management industry as well as the lesser-known specialized waste management companies. In fact, potential investors might even find the services offered as unique, interesting, and without a doubt critically necessary. Company and Symbol Percentage of Fund’s Holdings Recent TTM P/E Recent EPS Recent Dividend Yield Industry Specialization What They Do Waste Management (NYSE: WM ) 11.09% 23.36 $2.17 3.03% Industrial Provides waste management through local subsidiaries. Collects, transports, recycles: paper, glass, plastics, metal, electronics. Owns landfill and landfill gas-to-energy facilities. Republic Services (NYSE: RSG ) 10.99% 25.23 1.69 2.82% Industrial Similar to Waste Management, collecting, transporting and recycling non-hazardous residential, municipal and industrial solid waste. Waste Connections (NYSE: WCN ) 10.61% 26.89 1.85 1.05% Industrial and Minerals Diversified. Managing, collecting, transferring, disposing and recycling of municipal and residential wastes. Recycles paper, glass, metals and compostable waste, as well as non-hazardous natural resource exploration wastes. Stericycle (NASDAQ: SRCL ) 10.70% 40.91 3.49 0.00% Healthcare Services Provides consulting and regulated compliant solutions for healthcare and commercial businesses. Subsidiaries in the Americas, Europe, and the Pacific. Collections include “sharps”, pharma, blood, dental, used safety products and veterinary waste. Steris Corp. (NYSE: STE ) 3.88% 29.92 2.25 1.49% Healthcare Services Medical sterilization equipment and services. Disinfection systems, surgical tables, OR storage, scrub sinks; OR and GI procedure accessories; patient tracking; cleansing products. Some brand names: Amsco, Hamo, Cmax, Reliance and Harmony Tetra (NASDAQ: TTEK ) 3.77% 17.57 1.50 1.22% Materials and Energy Engineering and consulting services; water management and infrastructure, oil sands, geotechnical and Arctic engineering services. Operates in Canada as well as the US. Cantel Medical Corp. (NYSE: CMN ) 3.74% 49.40 1.09 0.19% Healthcare Services/Consumer Products Infection Prevention; GI equipment reprocessing, sterilants, detergents; disposable healthcare products; dialysis disinfection; biological packaging; and water purification. US, Canada and Puerto Rico. Progressive Waste Solutions (NYSE: BIN ) 3.69% 26.77 1.02 1.92% Industrial Municipal and residential waste management; landscape collection and recycling, recycling centers and landfill operations; portable toilets; waste audits and education/event services. Serves US, and Canada. ABM Industries (NYSE: ABM ) 3.68% 22.72 1.45 1.94% Industrial Provides integrated facilities solutions for commercial, government, institutions, hotel, airports, data centers, high-tech manufacturing. Commercial cleaning, maintenance and repair, HVAC maintenance, janitorial, security, parking management. US and Canada. US Ecology, Inc. (NASDAQ: ECOL ) 3.56% 35.22 1.38 1.48% Industrial/ Mineral Collection, transportation, treatment, disposal, recycling of hazardous, non-hazardous, and radioactive wastes. Chemical cleaning, decontamination, spill and emergency response. Operates in US and Canada. (Data from Van Eck and Reuters) Overall, 5 of all 21 holdings have a negative trailing twelve-month (TTM) EPS. The fund’s average EPS is positive at 0.96. The average TTM P/E is 25.5195 and the average dividend yield is 1.23%. The fund has a total of $15.6 million in total net assets. Its gross expense ratio is somewhat high at 0.92%, however, according to Van Eck, expenses for the fund are capped at 0.55% through January of 2016. As noted above, the fund is very thinly traded averaging 250 shares per day, over the past 30 days. The fund is currently trading at a slight premium to NAV of 0.03%. The share price was $62.51 as of the close on August 7, $0.03 over the NAV. The following table is a summary of the fund’s basic metrics: 1 Month 3 Months YTD 1 Year 3 Year 5 Year Since Inception 10/10/06 EVX -0.54 -1.1 -4.51 -2.32 9.82 8.67 6.45 EVX Shares -0.65 -1.55 -6.04 -4.37 9.67 8.57 6.41 AXENV Index -0.5 -1.01 -4.45 -2.16 10.29 9.20 6.99 (Data from Van Eck) Lastly, the fund pays a yearly dividend, as summarized in the table: (Data from Van Eck) A word or two needs to be said about a few of the holdings. For example, Newpark Resources (NYSE: NR ) , 2.01% of the holdings, is actually an oil and gas driller and only loosely connected to the management of resource waste management, per se. The company emphasizes its corporate responsibility to the environment as a provider of sustainable and ecologically-friendly drilling services in the industry. Needless to say, the company has been affected recently by overproduction in the oil and gas industry. Tenneco (NYSE: TEN ) , 3.00%, manufactures catalytic converters and diesel oxidation catalysts for combustion engines, thus indirectly managing carbon emission waste. Schnitzer Steel (NASDAQ: SCHN ) , 1.80%, specializes in large-scale metals shredding, blending and recycling to customer specifications, thus reducing landfill waste. Layne Christensen (NASDAQ: LAYN ), 1.86%, specializes in water management, drilling and construction. Darling Ingredients (NYSE: DAR ) , 3.03%, manufactures sustainable natural ingredients for edible and inedible bio-nutrients. These examples demonstrate that not every holding is a “pure-play”, which goes “out into the field”. They and others in the fund recycle or repurpose what would otherwise be an unusable waste product. However, all of the companies do relate to the central theme of hazardous and non-hazardous waste management: transportation, recycling, repurposing, filtration, disposal and also environmental consulting services. Since the sector has so few participants, it’s reasonable to consider the potential of competition and then pricing power. It’s reasonable, but not likely as EPA regulations require licensing, certification, inspection and needless to say accountability if something should go wrong. Thus, it would be difficult, expensive and time consuming for new entrants to establish themselves in this sector. On the other hand, an outright purchase of an established specialized waste management company would be far simpler. Recent headline-making events such as oil drilling accidents, freight train derailments causing chemical spills and fires requiring the evacuations of entire towns, coal wastewater ponds leaking into the water table, difficult or untreatable hospital infections, salmonella bacterial contamination in food production, contaminated HVAC cooling towers causing the often fatal Legionnaires’ disease, all indicate the growing need to fill a large niche for private sector investment. The Van Eck Market Vectors ETF is one of the few funds which specialize in environmental service. The companies in this fund are mostly profitable to the point of paying dividends. Once more, the lack of a market for the ETF shares will make this difficult to trade. But the fund will give a long-term investor with a little extra risk capital and patience, an opportunity to hold a diversified position in a growing industry, increasingly mandated by law and public demand. Disclosure: I/we have no positions in any stocks mentioned, and no plans to initiate any positions within the next 72 hours. (More…) I wrote this article myself, and it expresses my own opinions. I am not receiving compensation for it (other than from Seeking Alpha). I have no business relationship with any company whose stock is mentioned in this article. Additional disclosure: CFDs, spread betting and FX can result in losses exceeding your initial deposit. They are not suitable for everyone, so please ensure you understand the risks. Seek independent financial advice if necessary. Nothing in this article should be considered a personal recommendation. It does not account for your personal circumstances or appetite for risk.