Tag Archives: earnings-center

Crisis Alpha: Surprising Ways To Hedge Stock Portfolio Risk

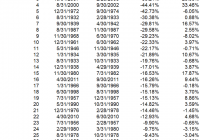
By Wesley R. Gray Investing in the current environment is difficult. Most, if not all, asset classes have high nominal prices, suggesting low nominal expected returns. Not exactly exciting. And for many investors who are retired and/or have near-term liquidity needs, investing in equity exposures – while necessary to generate higher expected returns – also prevents many investors from sleeping at night! One solution to curb the risk of a massive market meltdown is to buy portfolio insurance. However, in a rational world, insurance contracts are expensive because they protect us when we need protection the most. Insurance has this pesky problem of charging a large premium for downside protection. For example, consider put options on the S&P 500 market index. If an investor wants to hedge against a 10% drawdown for a year, the cost (as of August 13, 2015) would be approximately 4% of the notional value to be hedged. So if you had a $1,000,000 stock portfolio and wanted to ensure the most you could lose was $100,000, the cost of that insurance for one year would be around $40,000. Clearly, buying portfolio insurance can be expensive. But what if we could identify unique assets where the cost of insurance was much lower? We’ve identified 3 candidates that may fit this profile: US Treasury Bonds Hedge Fund Factors Managed Futures We highlight some of the historical evidence of the abilities of these assets to provide portfolio insurance (they go way up, when stock markets go way down). Of course, past performance is no guarantee of future performance, and nobody can know what will happen in the future, but the results inspired us to dig a little deeper and think harder about our own portfolio construction efforts. 1. US Treasury Bonds The results below highlight the top 30 drawdowns in the S&P 500 Total Return Index from 1927 to 2013. Results are gross of management fees and transaction costs. All returns are total returns and include the reinvestment of distributions (e.g., dividends). Next to the S&P 500 return is the corresponding total return on the 10-Year (LTR) over the same drawdown period. Bottom line: When the market blows up, flight-to-quality 10-Years have done well. (click to enlarge) The results are hypothetical results and are NOT an indicator of future results and do NOT represent returns that any investor actually attained. Indexes are unmanaged, do not reflect management or trading fees, and one cannot invest directly in an index. Additional information regarding the construction of these results is available upon request. 2. Hedge Fund Factors We examine 3 common hedge fund “factor” portfolios alongside the S&P 500 Index: S&P 500 = S&P 500 Total Return Index HML = The average of 2 value portfolios (small and large) minus the average return of two growth portfolios (again, small and large) MOM = The average of 2 high return portfolios (small and large) minus the average return of two low return portfolios (small and large) QMJ = The average of 2 high-quality portfolios (small and large) minus the average return of two low-quality portfolios (small and large) Results are gross of management fees and transaction costs. All returns are total returns and include the reinvestment of distributions (e.g., dividends). Data are from AQR and Ken French . Next to the S&P 500 return is the corresponding total return on hedge fund factors over the same drawdown period. Bottom line: When the market blows up, hedge fund factors have done well. (click to enlarge) The results are hypothetical results and are NOT an indicator of future results and do NOT represent returns that any investor actually attained. Indexes are unmanaged, do not reflect management or trading fees, and one cannot invest directly in an index. Additional information regarding the construction of these results is available upon request. 3. Managed Futures Here we examine a chart from a white paper by the folks at AQR. The paper is called, “A Century of Evidence on Trend-Following Investing.” The trend-following concept analyzed can be considered a generic managed futures strategy. Bottom line: When the market blows up, trend-following managed futures have done well. (click to enlarge) The results are hypothetical results and are NOT an indicator of future results and do NOT represent returns that any investor actually attained. Indexes are unmanaged, do not reflect management or trading fees, and one cannot invest directly in an index. Additional information regarding the construction of these results is available upon request. Conclusion Historically, Treasury Bonds, Hedge Fund Factors, and Managed Futures have all managed to act like portfolio insurance, even though they aren’t traditionally considered insurance assets. Will this pattern continue in the future? Who knows…and of course, that is the million dollar question… Let us know if you’ve seen other hidden portfolio insurance options out there. Please share ideas… Original Post

Monday Morning Memo: ESG Criteria As A Tool For Stock Selection

By Detlef Glow Stock selection is one of the most critical aspects for equity fund managers, since that is the point where they are supposed to deliver so-called alpha as value added from active management and therefore the justification for their management fee. I have had a number of meetings with portfolio managers over the past 20 years, and most of them told me they try to find high-quality stocks. That said, one can imagine the quality of a stock is defined differently by each manager. Asked how they evaluate quality, most managers told me they have implied quantitative screens for financial data, and they meet with the management of companies to verify future expectations of the companies’ operation. But few of the fund managers told me they use environmental, social, or governance (ESG) criteria for stock selection. Nevertheless, nowadays a number of portfolio managers employ at least one ESG criterion in their screening process. This shows that the integration of ESG criteria has gained ground in the conventional asset management industry. From my point of view it is not surprising that even conventional fund managers have started to use ESG criteria, since these data deliver a unique view of a company that is not dependent on financial data. Fund managers who employ ESG data and criteria in their selection process have an opportunity to gain a competitive edge through the use of information that is not used by their competitors. But, what information can be gathered from ESG criteria? Using ESG criteria the research process should lead to companies that have good policies on environmental and social aspects and a strong management that follows best-practice guidelines and has no conflicts of interest. In more detail ESG data can be used to identify so-called corporate-specific risks, i.e., the risk of fatalities, outages, fraud, or strikes as well as macro risks such as labor intensity or a shortage of skills, weather impacts, data protection, security issues, or possible water shortages. From my perspective the lack of education is a key factor of why ESG criteria will not be used widely in the asset management industry in the short term. But, with the turnover in staff and the educational efforts by industry associations and promoters of advanced education courses, the use of ESG criteria will become more popular over time. There is evidence that investors from Generations X and Y are more demanding with regard to information about how their money is invested. In addition, surveys have shown that investors from these generations are also more tuned to a lifestyle of health and sustainability and want to invest their money in funds that have similar goals in place. This means the demand from investors for products using a sustainable investment approach should increase, since Generations X and Y have just started to become investors. From my point of view this demand will be the main driver for a change in thinking and acting within the wider asset-management industry. Early adaptors might be the winners in this trend, since they can build up a reputation as thought leaders, along with a performance track record, prior to their competitors. The views expressed are the views of the author, not necessarily those of Thomson Reuters.

What Is Portfolio ‘Risk’?

The idea of risk is a rather confusing and nebulous concept in modern finance. The traditional textbook definition of “risk” is standard deviation or volatility. This is convenient for academic purposes because it allows us to quantify risk in a portfolio. But this is a flawed concept for several reasons: Volatility isn’t always a bad thing. In fact, volatility with a positive skew is a good thing. No one complains about a portfolio allocation that rises 20% per year and falls 5% every once in a while, but this is a volatile position relative to many portfolios. Negative skew can be a good thing in a portfolio. For instance, many forms of insurance have a natural negative skew and detract from returns; however, it would be bizarre to argue that this is always a bad idea even if you don’t have to use the insurance. Investors don’t live in a textbook world and don’t necessarily judge their portfolios by the academic concepts that drive the way many portfolio managers assess their portfolio performance. This can create a conflict of interest between the investor’s perception of risk management and the asset manager’s perception of risk management. For most investors the “risk” of owning financial assets is not having enough financial assets when you need them. This arises primarily from two factors: Purchasing power risk. Permanent loss risk. Permanent loss risk occurs when your savings is declining in value and you’re forced to take a loss for some reason (emergency, behavioral, short-termism, etc.). Purchasing power risk is the potential that your savings does not keep pace with the rate of inflation. In order to visualize how one might protect against these risks in a portfolio, it’s helpful to view this concept on a scale showing how our savings can be allocated across different assets: The investor who wanted to be protected against permanent loss risk would be 100% cash; however, they would risk falling behind in purchasing power by the rate of inflation each year. Likewise, the investor who wanted to be protected against purchasing power risk would be 100% stocks. A balanced portfolio will tend to protect against these risks somewhat evenly and in my experience investors tend to be more worried about protecting their savings from permanent loss than Modern Finance often implies. Viewing the world through the lens of this Savings Portfolio Scale will provide investors with a much more realistic and balanced perspective of how market risk applies to their actual savings. Share this article with a colleague