Tag Archives: dividend

2 Aristocrat ETFs

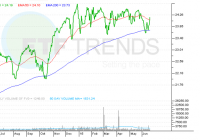
Summary Both NOBL and SDY replicate the S&P Dividend Aristocrats Index. A long-term investor might consider to possess a position in this type of ETF instead of purchasing dozens of different stocks. Here is a comparison between these two ETFs with high-quality holdings. Following my recent article regarding the SPDR Dividend ETF (NYSEARCA: SDY ), I have been asked whether SDY is also attractive when compared to the ProShares S&P 500 Dividend Aristocrats ETF (NYSEARCA: NOBL ). In order to compare between these two exchange-traded funds, I have added a third benchmark that represents the S&P 500 Index: the SPDR S&P 500 Trust ETF (NYSEARCA: SPY ). At first, I looked at the profile of the two ETFs that aim to follow the Dividend Aristocrats index. ETF Profile: Based on information from etfdb.com, it seems that in term of fees, both SDY and NOBL share the same expense ratio at 0.35% a year. SPY is cheaper, as it charges only 0.09%. Another observation is that the number of SDY’s holdings is double that of NOBL’s holdings. SDY is actually following the S&P High Yield Dividend Aristocrats Index, or “The Index of Champions”. This list includes more than 100 companies and can be found in David Fish’s CCC list . This is a composition of companies that increased their dividends in the last 25 consecutive years, including companies that had paid higher dividends in every calendar year. NOBL includes 53 holdings which follow the criterion of annual dividend increase for at least 25 years. The full list of Dividend Aristocrats can be found here . The difference in lists is demonstrated through both the top ten holdings and the sector-wise distribution of each ETF’s holdings: (click to enlarge) (click to enlarge) While NOBL holdings are leaning towards Consumer Defensive and Industrial sectors with companies like The Procter & Gamble Company (NYSE: PG ), Johnson & Johnson (NYSE: JNJ ) and Pentair Inc. (NYSE: PNR ), SDY is almost equally invested in Consumer Defensive, Industrials as well as Financial Services and REITs. Companies like Federal Realty Investment Trust (NYSE: FRT ), National Retail Properties, Inc. (NYSE: NNN ) and 1st Source Corporation (NASDAQ: SRCE ) are captured in SDY and not in NOBL. That is the reason why SDY can provide a higher dividend yield. ETF Performance: When comparing the performance of SDY, NOBL and SPY, we can see that since January 2014 until September 2015, NOBL actually did very well. In the recent sell-off, it actually dropped the least compared to the other two ETFs. NOBL ETF was established in late 2013, so it does not possess a historical performance track record. SDY’s return is lower on both the 3-year returns as well as the 5-year returns compared to SPY, as it is heavily tending towards Value holdings, while SPY’s holdings includes Growth companies. ETF Volatility: When comparing the volatility of these three ETFs, based on the Coefficient of Variation metric (Standard deviation divided by Average price), it was SDY which demonstrated the lowest volatility in the long run (0.035), while NOBL demonstrated lower volatility throughout the recent sell-off (0.023). ETF Payout: Both NOBL and SDY are trying to follow an index of dividend-paying stocks. NOBL has a short payout history, and therefore, by using the 2014 payout levels, which was 80c per share, the dividend yield in 2015 should be ~1.74%. If extrapolating the distribution that was paid in the first half of 2015, the dividend yield is expected to be closer to 2%. So, NOBL’s dividend rate is ~2%. SDY usually pays an extra payout in the last quarter of a calendar year. Using at the distribution levels of $3.74 per share in 2014, the yield is very close to 4%. Using the first half of 2015 as a proxy for the second half of the year, the yield is 2.5%. In either case, it is clear that the higher diversity that SDY holds allows the ETF to pay higher dividend yield to its shareholders. Conclusions: Both SDY and NOBL are ETFs that replicate indexes of top quality. NOBL’s core holdings are the top 50 Dividend Aristocrats, while SDY’s holdings list is broader. The broader list allows SDY to pay higher dividend, but it holds slightly higher risk. For investors who seek dividend income, SDY is the way to go. For investors who seek high quality with low volatility, NOBL is the way to go. For investors who are willing to take higher risk, care less about the dividend for higher return in the long run, SPY is the way to go. I am currently in favor of SDY due to its payout. Disclosure: I/we have no positions in any stocks mentioned, and no plans to initiate any positions within the next 72 hours. (More…) I wrote this article myself, and it expresses my own opinions. I am not receiving compensation for it (other than from Seeking Alpha). I have no business relationship with any company whose stock is mentioned in this article. Additional disclosure: The opinions of the author are not recommendations to either buy or sell any security. Please do your own research prior to making any investment decision.

After The Fall: The Dividend Aristocrats Detailed

Summary Loss averse investors with long-run horizons should not be heading to the sidelines, but rather looking to buy quality businesses on weakness. An index tracking the Dividend Aristocrats has outperformed the S&P 500, producing higher average returns with lower variability of returns over the trailing quarter-century. This article details the components of this index, with current valuation and year-to-date performance, to highlight companies that may outpeform through the next bout of volatility. In yesterday’s article entitled ” Stocks Will Go Higher “, I showed readers that over ten year periods, stocks almost invariably produce positive returns, and suggested the readers plan to buy high quality businesses on weakness and be prepared to hold these investments for long time periods. If history is a guide, such a strategy is very likely to come out a winner. (click to enlarge) Sources: Standard and Poor’s; Robert Shiller (Blue Line is price returns and pink line includes dividends) That article was spurred by a recent quote by famed investor and CEO of Berkshire Hathaway ( BRK.A , BRK.B ), Warren Buffett, who stated in an August 10th interview on CNBC that ” Stocks are going to be higher, and perhaps a lot higher 10 years from now, 20 years for now .” In this same interview, Buffett went further stating that “my game is to own decent businesses and decent prices and you are going to make a lot of money over time.” A strategy populated by good businesses that have generated market beating returns over times is the Dividend Aristocrats. The Dividend Aristocrats are S&P 500 (NYSEARCA: SPY ) constituents that have followed a policy of increasing dividends every year for at least 25 consecutive years. To be included in this index, these companies, at a minimum, have paid increasing dividends through the Eurozone Sovereign Crisis, the Global Financial Crisis, the Tech Bubble, and the early 1990s recession. These are the types of businesses that would be likely to produce market-beating risk-adjusted returns through the next downturn as well. Heeding Buffett’s advice, perhaps buying these businesses on weakness will spur market beating returns prospectively. Demonstrating this success, below is the cumulative total return of the S&P 500 Dividend Aristocrats Index, which is replicated by the ProShares S&P 500 Dividend Aristocrats ETF (NYSEARCA: NOBL ). (click to enlarge) Source: Standard and Poor’s; Bloomberg The Dividend Aristocrats have produced higher average annual returns, outperforming the S&P 500 by 2.5% per year. This approach has also produced returns with roughly three-quarters of the risk of the market, as measured by the standard deviation of annual returns. This long-run outperformance saw this strategy included in my “5 Ways to Beat the Market .” Given the weak domestic equity market performance in August, I wanted to detail the Dividend Aristocrat components for Seeking Alpha readers with current P/E ratio and year-to-date performance. (click to enlarge) For the broad “Investing for Income” community on Seeking Alpha, I have also sorted the list of Dividend Aristocrat constituents descending by dividend yield. (click to enlarge) If you are a long-term investor, looking to buy solid businesses on weakness, perhaps this list of companies who can weather another bout of market-related volatility. If readers find this helpful, I will also put together a list of the constituents of the Low Volatility Index, another factor tilt towards high quality businesses that has generated long-run alpha. Disclaimer: My articles may contain statements and projections that are forward-looking in nature, and therefore inherently subject to numerous risks, uncertainties and assumptions. While my articles focus on generating long-term risk-adjusted returns, investment decisions necessarily involve the risk of loss of principal. Individual investor circumstances vary significantly, and information gleaned from my articles should be applied to your own unique investment situation, objectives, risk tolerance, and investment horizon. Disclosure: I am/we are long NOBL, SPY. (More…) I wrote this article myself, and it expresses my own opinions. I am not receiving compensation for it (other than from Seeking Alpha). I have no business relationship with any company whose stock is mentioned in this article.

Income And Caution With This Dividend ETF

Summary Dividend ETFs may generate attractive yields, but they are exposed to rate-sensitive sectors. Highlight of the First Trust Value Line Dividend Index Fund. Significant utilities sector position is weighing in on performance. By Todd Shriber & Tom Lydon With Treasury yields rising and concerns that the Federal Reserve will boost interest rates in the coming months doing the same, some dividend exchange traded funds are lagging broader benchmarks. That is true of the First Trust Value Line Dividend Index ETF (NYSEARCA: FVD ) , which has traded modestly lower this year while the S&P 500 has gained 2.5%. FVD follows the Value Line Dividend Index, which equally weights components and utilizes the proprietary Value Line research to select components. Specifically, stocks are ranked by the Value Line Safety Ranking of 1 or 2 out of 5, which are based on price stability and financial strength. Additionally, the index excludes stocks with a dividend yield lower than the S&P 500. “Over the last 10 years, FVD produced an annual average 10.4% gain vs. 7.9% for the S&P 500,” according to Investor’s Business Daily . “Their difference in their current dividend yield is modest. FVD yields 2.2% and SPY 1.9%.” Though its yield is attractive relative to the S&P 500, it is the source of that yield that could be a strike against FVD in a rising rate environment. Specifically, the ETF allocates 22.6% of its weight to utilities stocks, the most vulnerable group to rising interest rates . FVD devotes another 13.5% of its weight to consumer staples stocks, another sector that historically lags when interest rates climb. FVD’s utilities and staples exposure is somewhat offset by a combined 32.3% weight to financial services and industrials names, groups that often perform as Fed policy turns hawkish. Rising Treasury yields and slumping utilities stocks have not been enough to sour investors on FVD. The ETF is home to nearly $1.21 billion in assets under management up from $955 million in October. The ETF’s technology weight of 8.1% is fair among dividend funds, but FVD allocates less than 2% to telecom, another highly rate-sensitive sector. FVD’s holdings are also equally weighted. FVD currently shows 187 holdings and its largest component stocks only make up 0.65% of the underlying portfolio. However, this strategic beta index-based ETF is more costly than the average dividend ETF. FVD shows a 0.70% expense ratio, compared to the average 0.58% expense ratio for dividend yield weighted ETFs and 0.5% expense ratio for the average dividend weighted ETF, according to XTF data. At 0.7%, FVD is twice as expensive as the SPDR S&P Dividend ETF (NYSEARCA: SDY ) and seven times as expensive as the Vanguard Dividend Appreciation ETF (NYSEARCA: VIG ) . First Trust Value Line Dividend Index Fund (click to enlarge) Disclosure: I/we have no positions in any stocks mentioned, and no plans to initiate any positions within the next 72 hours. (More…) I wrote this article myself, and it expresses my own opinions. I am not receiving compensation for it. I have no business relationship with any company whose stock is mentioned in this article.