Tag Archives: dividend

Highest Dividend ETF Portfolio: How To Find The Best High Dividend ETF Funds

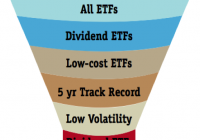
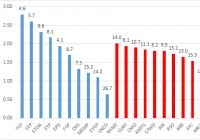
Originally published on February 3, 2014. Updated on January 23, 2015. How to create the highest dividend ETF portfolio The best investors become specialists in an area of investment interest such as stocks that pay dividends. They absorb as much information as they can in that one area. Gaining more knowledge increases the chance of making more money, even if you already have an advisor. These specialists realize that every investment area has multiple layers of complexity that can take time to understand. This article is a high level overview of how to create a dividend ETF portfolio. It shares the process of finding and selecting the best dividend ETFs for a high dividend ETF portfolio. Here is the best process for creating the highest dividend ETF portfolio within the confines of low volatility: The First Step in Building the Highest Dividend ETF Portfolio: Screening for the Best High Dividend ETFs Here are some of the broad details of the screening process you should consider: Start with all available ETFs. Screen for dividend ETFs: Find all ETFs that specialize in dividend paying companies and/or pay at least a 3% dividend. Rank all of these dividend ETFs by internal cost from lowest to highest and throw out the bottom 50% of the most expensive. Numerous studies show that cost is one of the most important factors of future performance. Then eliminate all dividend ETF funds that do not have a five year track record. You need to be able to see how they have been replicating the index, and buying a new fund that closes down is not good investing. Next, eliminate all dividend ETFs that have more volatility than the Russell 3000 Index. Dividend ETF portfolios are for income, and a stable price helps reduce the chance of losing more money on price than you are making on the dividend. Important Concepts in the Screening Process for Creating the Highest Dividend ETF Portfolio Do not search for highest dividend ETF until you have completed this screening process. Once this process is done then you have a great group of low cost, low volatility dividend ETFs with at least a five year track record. Searching for the best high dividend ETF fund based solely on dividend will lead you in the wrong direction. You will mostly find a dividend ETF that loses more on the price than it makes on the dividend. Ignore how much money the ETF has made in the past. We only want to know that the ETF has been in existence for at least five years so that we can examine the liquidity and portfolio drift issues. Past performance does not equal future results. Timing when to buy an ETF and when to sell does not work. No one knows where any one investment is going. The vast majority of investors believe market timing works, which is great for the brokerage firms. We think if the majority of high cost mutual funds with all their highly educated portfolio managers, unbelievable research, and superior technology cannot beat their comparable indexes then we will leave trying to time the market to someone else. Next Steps to Create Your Highest Dividend ETF Portfolio Place all of the dividend ETFs that survived the above screen into efficient frontier software. Use the Capital Asset Pricing Model (CAPM) to replace the historical rates of return in your efficient frontier analysis. Using historical returns produces over-concentrated portfolios that worked great in the past. Unless you have a time machine, you want portfolios that work great in the future. Using CAPM to replace historical returns is the first step to make a well balanced portfolio. Do not ignore rising dividend ETF funds just because they pay a low dividend. Often these funds are great to combine with a higher dividend payer such as a utility ETF. The combination provides greater price stability with a good dividend payout. Look for some international dividend ETFs to round out your portfolio. The world is a big place, and we never know where money will go next. Having the proper amount of international exposure actually lowers the overall price volatility of your portfolio. Share this article with a colleague

Higher Dividends With Less Risk (Part 3): Global X SuperDividend U.S. ETF

Summary This is the third piece in this series of articles looking at high-dividend low-volatility funds. DIV tracks the INDXX SuperDividend U.S. Low Volatility Index. How does the composition of DIV compare to other high-dividend low-volatility funds HDLV and SPHD, and to the popular “quality” ETF DVY? Introduction High-income strategies and funds have exploded in popularity in recent years as the low-interest rate environment has prodded yield-starved investors to seek richer, and perhaps more risky, sources of income. Earlier this month, investors who sought higher yields in junk bonds and emerging market debt experienced a mini-correction as the crash in oil prices sparked fears that energy or energy-related companies (or countries!) could become insolvent. High-yielding securities can also be found within the realm of equities. Several classes of stocks have historically paid out high distributions, such as real estate investment trusts [REITs], mortgage REITs, business development companies [BDCs] and master limited partnerships [MLPs]. Similar to bonds, higher-yielding companies are often perceived to carry higher risk. In the first two articles of this series, we examined the PowerShares S&P 500 High Dividend Portfolio ETF (NYSEARCA: SPHD ) (article here ) and UBS’s ETRACS 2xLeveraged U.S. High Dividend Low Volatility ETN (NYSEARCA: HDLV ) (article here ) and compared these with each other and with popular “quality” dividend ETFs such as Vanguard Dividend Appreciation ETF (NYSEARCA: VIG ), Vanguard High Dividend Yield ETF (NYSEARCA: VYM ) and Schwab U.S. Dividend Equity ETF (NYSEARCA: SCHD ). We found that SPHD and HDLV were able to meet their dual objectives of higher dividends with lower volatility by favoring more defensive sectors such as utilities, telecommunications, and REITs. In what is likely to be the final article of this series, we will examine the Global X SuperDividend U.S. ETF (NYSEARCA: DIV ) and compare it with the other funds of its class, HDLV and SPHD. Additionally, the iShares Select Dividend ETF (NYSEARCA: DVY ) will represent a “quality” dividend ETF for comparative purposes. Global X SuperDividend U.S. ETF DIV debuted in March 2013, and tracks the INDXX SuperDividend U.S. Low Volatility Index, which was launched in February, 2008. Meanwhile, HDLV tracks the Solactive U.S. High Dividend Low Volatility Index and SPHD tracks the S&P 500 Low Volatility High Dividend Index. DVY tracks the Dow Jones U.S. Select Dividend Index. Fund details Details for the four dividend funds are shown in the table below (data from Morningstar ). Note that HDLV is a 2X leveraged ETN and the yield listed is the 2X leveraged yield.   DIV HDLV SPHD DVY Yield 5.59% 9.31%* 3.30% 2.52% Payout schedule Monthly Monthly Monthly Quarterly Expense ratio 0.45% 0.85%^ 0.30% 0.39% Inception Mar 2013 Sep 2014 Oct 2012 Nov 2003 Assets $299M $28M $255 $15.7B Avg Vol. 80K 20.6K 45K 745K No. holdings 50 40 50 100 Annual turnover 20% (unknown) 47% 22% *Estimated yield from 2X the weighted average yield of constituents (4.66%). ^Does not include financing fee (LIBOR + 0.60%). DVY is one of the oldest dividend ETFs on the market. It has a massive $15.7B in assets, would be large enough to qualify it as a large-cap company. DIV, SPHD and HDLV are much smaller funds, with DIV being the largest at $299M. The liquidity for DIV is respectable, at 80K shares. DIV has a reasonable expense ratio of 0.45%, which is slightly higher than DVY’s (0.39%). SPHD has the lowest expense ratio of 0.30% while HDLV’s is the highest at 0.85% (does not include financing fee). DIV also has the highest dividend yield of 5.59% out of the four dividend funds. HDLV’s 1X yield is 4.66% while SPHD has a 3.30% yield. DVY has the lowest yield of 2.52%. Methodology The methodology for the INDXX SuperDividend U.S. Low Volatility Index is shown in the steps below (source: INDXX ). Select U.S. companies that trade on the U.S. stock exchanges that fulfill the following requirements: market cap > $500M, daily turnover > $1M, public float > 10%, beta 50% dividend cut in the previous year. MLPs and REITs are included but BDCs are excluded. Rank eligible stocks by dividend yield. The top 200 yielding companies form the “selection pool”. The 50 companies with the highest yields are chosen for inclusion into the index and are equally weighted. Every quarter, remove companies with dividend cuts or negative dividend outlooks and replace with another company in the selection pool (weightings are unchanged). Every year, reconstitute the index using the above methodology. How does this methodology compare to the other two high-dividend low-volatility ETFs? For easier comparison, I have put the data into a table.   DIV HDLV SPHD Universe U.S. companies on U.S. exchanges with market cap > $500M, trading volume > $1M, public float > 10%, beta 50% dividend cut in the previous year. BDCs are excluded. Top 200 market cap names for U.S. companies on U.S. exchanges with market cap > $1B and trading volume > $15M. MLPs are excluded. S&P 500 Primary screen (yield) Select top 50 companies with the highest dividend yield Of those 200, select top 80 with the highest forward distribution yield Of those 500, select top 75 stocks with highest 12-month trailing yields, with the number of stocks from each GICS sector capped at 10 Secondary screen (volatility) (Beta