Tag Archives: dividend-ideas

Alliant Energy: Earnings Growth Looks Good, But Cheaper Valuations Could Be In Its Future

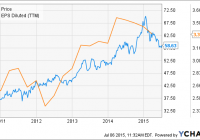
Summary Midwest electric and natural gas utility holding company Alliant Energy has seen its share price drop since May due to a relatively weak Q1 and bearish sector sentiment. The company’s future earnings growth looks attractive due to the presence of strong state economies in its service area and compelling arguments for new electric generation capacity. While its shares appear to be fairly valued following the recent price decline, I believe that warm winter weather resulting from El Niño conditions could make them undervalued. Short-term uncertainty aside, however, I am optimistic regarding the company’s long-term earnings potential due to its geographic location and favorable regulatory developments. The share price of public utility holding company Alliant Energy (NYSE: LNT ) approached its 1-year low last month, following both its trailing EPS (see figure) and share prices in the broader utilities sector lower in the process. The company’s share price is now trading 17% below its YTD and all-time high. While the sector has been hit by bearish sentiment of late as investors have moved away from utilities in anticipation of higher bond yields being available later in the year, Alliant’s recent downturn makes its shares look more attractive than at any other point in the last several months. This article evaluates the company as a potential long-term investment. LNT data by YCharts Alliant Energy at a glance Alliant Energy is a Wisconsin-based public utility holding company that has operated in its current form since 1981. It operates two primary subsidiary regulated utilities, Interstate Power & Light [IPL] and Wisconsin Power & Light [WPL]. IPL generates electricity and distributes electricity and natural gas to customers in Iowa and southern Minnesota. WPL provides the same services in Wisconsin. Between them, the two subsidiaries have a total of 1 million electric customers and 420,000 natural gas customers. Their combined electric generation capacity is 30 million MWh per year with a maximum peak hour demand capacity of 5,426 MW, and their annual natural gas sales and transportation volume was 123,446 thousand dekatherms in the most recent fiscal year. The electric generation capacity is divided between coal, natural gas, and renewables (primarily wind), although the combined capacity of the latter two has grown significantly over the last decade at the expense of the former. This trend is to continue over the next decade as the company replaces roughly 50% of its current coal capacity with additional natural gas and wind capacity. Alliant Energy is in the process of investing heavily in this new capacity. The natural gas capacity will take the form of two 650 MW combined cycle natural gas facilities costing a total of $1.7 billion, the first of which is expected to come online in FY 2016 (followed by the second in FY 2019). These two facilities will replace expired purchase power agreements as well as existing coal-fired capacity, thereby both reducing the company’s emissions and increasing its earnings potential. Additional capacity is expected to bring the company’s total investment to $2.5 billion by 2023. Of the two primary utilities subsidiaries, IPL is slightly larger than WPL, generating 56% of their combined operating revenue in FY 2014. Alliant Energy also owns a Resources segment that oversees non-regulated transportation services, including rail transport, barge transport, and 1.3 million tons of coal terminal capacity. Finally, the company has a 16% stake in American Transmission Company [ATC], which provides electric transmission services in Wisconsin and Michigan’s Upper Peninsula. ATC operates under a very favorable regulatory scheme with an allowed ROE of 12.2% on its 50% equity share. While it is currently operating from a relatively small base, it will likely experience company-beating earnings growth due to its relatively high ROE resulting from its investment in several transmission projects located in the western U.S. as part of a joint venture with Duke Energy (NYSE: DUK ). Alliant Energy has also been paring its less-profitable assets as a means of partially-financing its large planned capex over the next several years. This effort recently saw the company close on the sale of its Minnesota gas distribution assets for a total of $13 million in cash and promissory notes as well as the planned sale of IPL’s Minnesota electric and gas distribution assets for a total of $140 million. The loss of the Minnesota electric distribution assets will be partially offset by wholesale power agreements with their purchaser. Alliant Energy has been one of the regulated utility sector’s better performers since the end of the financial crisis, delivering a combination of earnings growth and steady dividend increases, the latter by as much as 8.5% annually (see figure). This record has been due in large part to its geographic footprint, with its service area being limited to states that fared very well during the Great Recession. Iowa, Minnesota, and Wisconsin largely missed out on the surging real estate market in 2005 and 2006, one effect of which was that they also managed to avoid the worst effects of the subprime mortgage crisis. Meanwhile, the recession did not hit the states hard due to their heavy exposure to the farm industry, which benefited strongly between 2008 and 2013 from rising biofuel blending requirements both at the state and federal levels. Furthermore, whereas old corn ethanol facilities largely depended on coal to provide process heat and power, newer facilities built after 2008 turned to natural gas instead to comply with federal regulations, boosting demand for Alliant Energy’s natural gas distribution services as corn ethanol capacity grew strongly (Iowa, Minnesota, and Wisconsin are three of the country’s largest producers of corn ethanol). Abnormally cold winters in recent years and a propane shortage in 2014 provided a further boost to the company’s earnings. LNT Normalized Diluted EPS (Annual YoY Growth) data by YCharts Q1 earnings Alliant Energy reported mildly disappointing Q1 earnings results at the end of Q1 that missed on both lines despite the presence of favorable operating conditions during the quarter. Revenue fell by 5.8% YoY from $952.8 million to $897.4 million, missing the consensus estimate by $10.7 million. The decline compared to the previous year was attributable to a combination of lower energy prices following last autumn’s big price decline and the presence of weather during the quarter that was warmer than in Q1 2014, albeit still colder than the long-term average. The company’s consolidated electric revenue fell by 0.6% YoY while its natural gas revenue dropped a substantial 17.6% over the same period. Electric sales volume declined by 2.9% YoY as the previous year’s propane shortage, which caused many customers to temporarily switch to electric heaters, disappeared, while natural gas sales volume decreased by 10.4%. Overall Q1’s weather was “only” 10% colder than the long-term average as compared to 20% colder than the long-term average in Q1 2014. The company’s operating income fell by only 0.8% YoY despite the revenue drop due to a 9.6% decrease to fuel costs resulting from low coal and natural gas prices. Net income fell to $96.6 million from $108.0 million the previous year. This resulted in diluted EPS of $0.87 versus $0.97 the previous year, missing the consensus estimate by $0.04. The EPS contained a mixed bag of information for the company’s investors. The relatively warm weather compared to the previous year reduced the result by $0.08, although it would have been lower still by another $0.04, had temperatures been closer to the long-term average. Changes to Alliant’s purchased power agreements boosted EPS by $0.13 compared to Q1 2014, however. IPL was a strong performer during the quarter, increasing its share of the company’s consolidated diluted EPS from 40% the previous year to 49%; WPL’s share fell to 46% from 51% over the same period. The strong quarterly performance caused Alliant’s balance sheet to strengthen as its operating cash flow increased by 7.2% YoY to $314.7 million. It ended the quarter with cash of $97.6 million and assets of $12.1 billion, up YoY in both cases from $14.5 million and $11.1 billion, respectively. The company’s balance sheet is not prone to the volatility experienced by those of many of its peers due to the very hot weather commonly experienced in its service area during Q2, with 170 degree temperature swings (including wind chill and heat index) not being unheard of in Iowa between Q1 and Q3. Even accounting for this relative lack of seasonality compared to those utilities that only experience earnings boosts either in Q1 (in northern geographic regions) or Q3 (in southern geographic regions), Alliant’s balance sheet still strengthened noticeably, with its current ratio improving to 0.9 from 0.68 in Q1 2014. The company has a moderate amount of long-term debt on its books at $3.6 billion, although this is available at low interest rates due to its very good credit rating (ranging from BBB+ to A). Management felt comfortable enough with its financial position in the quarter to increase the company’s quarterly dividend by an impressive 8.5% to $0.55, representing a forward yield of 3.7% at the time of writing. Alliant Energy Financials (non-adjusted) Q1 2015 Q4 2014 Q3 2014 Q2 2014 Q1 2014 Revenue ($MM) 897.4 804.1 843.1 750.3 952.8 Gross income ($MM) 427.5 397.5 476.5 385.7 438.1 Net income ($MM) 96.6 60.0 153.3 61.8 108.0 Diluted EPS ($) 0.87 0.54 1.38 0.56 0.97 EBITDA ($MM) 266.5 206.2 311.9 218.7 271.9 Source: Morningstar (2015) Outlook Alliant Energy’s short-term outlook is bright, although weather-related impacts could provide a headwind (this is very uncertain at this time, however). With a substantial cash reserve, $934 million in available liquidity from existing credit facilities, and pending asset sales, Alliant will have no difficulty financing its near-term planned capital expenditure. This will reach $1 billion in FY 2015, including $300 million in new capacity investments. Management reaffirmed its FY 2015 diluted EPS guidance of $3.45 to $3.75 during its Q1 earnings call which, in addition to representing a 4% increase over its FY 2014 earnings if the middle of the range is achieved, would also provide sufficient operating cash flow to proceed with the company’s planned capital expenditures. This capex in turn will drive rate base growth of 4% and 6% CAGR for IPL and WPL, respectively, through FY 2017. Given Alliant’s current favorable allowed ROEs of 10% and 10.4% for IPL and WPL, respectively, plus a sharing mechanism for WPL ROEs of up to 11.4%, management’s goal of 6% EPS growth will be achievable. The main short-term risk that Alliant Energy faces to its short-term earnings growth is presented by the prospect of El Niño conditions during the coming winter. These conditions are expected to begin manifesting themselves this autumn and, if pronounced enough, they could push the polar jet stream during the winter further north than usual. This would result in warmer weather across the company’s service area during Q4 2015 and Q1 2016, reducing demand for natural gas and, to a lesser extent, electricity. Furthermore, the lack of temperature fluctuations could also reduce the availability of wind power in the Central Plains, possibly extending to Alliant’s wind capacity. Weather forecasts are notoriously inaccurate – to quote Niels Bohr, “Prediction is very difficult, especially about the future” – so investors certainly shouldn’t assume that Alliant’s earnings will weaken this winter. It is a risk to consider, however. In the longer term, however, Alliant’s management has laid out a convincing path to continued steady earnings growth. The economies in its service area continue to exhibit the kind of strength that would make many regions of the U.S. jealous, with Iowa, Minnesota, and Wisconsin all reporting unemployment rates that are well below the U.S. average (see figure). While corn ethanol’s saturation of the U.S. transportation fuel market and a lack of substantial population growth means that natural gas demand in the Midwest is unlikely to increase in the coming years, the presence of continued U.S. blending mandates means that it is unlikely to weaken either. This will support the company indirectly as well in the form of electricity income, as the agricultural/food processing sector was responsible for fully 29% of IPL’s electric sales and 9% of WPL’s electric sales in FY 2014. Iowa Unemployment Rate data by YCharts A combination of weakness in the natural gas market and regulatory opposition to coal at the federal level will support Alliant’s rate base case moving forward as well by making new gas-fired capacity competitive with old coal-fired capacity. Likewise, regulatory opposition to coal will also make wind power more attractive as well. The company, which already has 1,168 MW of wind power, intends to double this by 2028 until wind capacity exceeds that of coal. It is also experimenting with solar power, although that is not as attractive as wind in the upper Midwest. Alliant will be able to make a convincing argument to the relevant state regulators that continued investments in new capacity will not just be necessary to comply with federal regulations but also to deliver the cheapest electricity to consumers, with the subsequent capex supporting rate base increases and earnings growth. Valuation Analyst estimates for Alliant Energy’s future earnings have held relatively steady over the last 90 days due to management’s guidance being reaffirmed at the end of Q1. The FY 2015 and FY 2016 consensus diluted EPS estimates have both increased slightly from $3.62 and $3.82 to $3.63 and $3.83, respectively. Based on the share price at the time of writing of $58.63, Alliant’s shares have a trailing P/E ratio of 17.4x and forward ratios of 16.2x and 15.3x, respectively. All three of these ratios are approximately in the middle of their respective 4-year ranges (see figure), suggesting that the company’s shares are fairly valued at present. LNT PE Ratio (TTM) data by YCharts Conclusion Alliant Energy has benefited over the last several years from operating in a service area with a stronger-than-average economy backed by a resilient farming sector and plentiful wind power. The company’s shares are not undervalued at present despite recent sector weakness, although they do present potential investors with an attractive earnings growth opportunity due to Alliant’s supportive regulatory structure and compelling long-term rate base growth argument. The company’s share price has historically tracked its quarterly earnings, however, and I believe that a more attractive buying opportunity could arise in the event that strong El Niño conditions result in warmer winter weather and diminished wind power in Q4 and Q1. Alliant Energy is one of the regulated utilities sector’s stronger offerings in either case. Disclosure: I/we have no positions in any stocks mentioned, and no plans to initiate any positions within the next 72 hours. (More…) I wrote this article myself, and it expresses my own opinions. I am not receiving compensation for it (other than from Seeking Alpha). I have no business relationship with any company whose stock is mentioned in this article.
Exelon’s Dividend Disappointing, But Valuation Tempting

Summary Exelon has one of the largest retail customer bases among energy providers in the US. Though Exelon boasts a nice dividend yield, dividend growth investors have been disappointed and rightfully so. The firm is in the process of acquiring energy provider Pepco, a potentially lucrative move. Let’s take a look at Exelon’s recent performance and derive our fair value estimate for shares. By Paul Tait (click to enlarge) Exelon (NYSE: EXC ) is one of the US’ largest competitive energy providers and perhaps is best known for operating the largest nuclear fleet with over 19,000 megawatts (nearly enough energy to power 19 million homes). That’s incredible! No matter how much we like the company, however, its dividend payouts haven’t been electric in recent years, to say the least. We said Exelon’s dividend wasn’t on steady ground in the past, and we strongly encourage investors to not simply write off utilities’ dividends as safe . First Energy (NYSE: FE ) was another utility that cut its dividend, and Exelon’s Dividend Cushion ratio remains a lackluster 0.7 (anything less than 1 is unexciting). In recent news, Exelon is in the process of acquiring Washington, DC-based utility-holder Pepco. The deal would strengthen the firm’s hold on the mid-Atlantic utility market, and should the acquisition go through, Exelon would control nearly 80% of Maryland’s electric consumers. Critics are worried about price hikes, but that’s why investors like utilities in the first place: they’re legal monopolies. In this piece, let’s dig deeper into Exelon’s investment considerations and derive our fair value estimate of the firm’s stock price. Exelon’s Investment Considerations Investment Highlights • Exelon is a large competitive energy provider, with one of the largest retail customer bases in the US. It owns approximately 35,000 megawatts of power generation, including the nation’s largest nuclear fleet of more than 19,000 megawatts. It is also the US’ second-largest regulated distributor of electricity and gas. • Exelon is an important reminder as to why utility dividends aren’t always safe. Though many utilities boast regulated returns, their operations do not lend themselves to substantial financial flexibility. Credit quality will always take priority over dividend payments at key credit thresholds. The Dividend Cushion ratio considers both future free cash flows, the capital intensity of the business, as well as future cash dividend payments in coming to a comprehensive assessment. • The merger of Exelon and Constellation Energy has created one of the lowest-cost power generation fleets in the US. The tie-up offers opportunities for O&M synergies, portfolio optimization, and overhead savings. More than half of the combined company’s portfolio will be low-cost nuclear. Its acquisition of Pepco will further augment its presence. • Exelon recently slashed its dividend to a payout of $1.24 per year. Even after the cut, we don’t think the firm has strong dividend growth prospects. We’re not expecting increases anytime soon. Dividend growth investors are quite unforgiving. They may never come back to Exelon… ever again. Business Quality Economic Profit Analysis In our opinion, the best measure of a firm’s ability to create value for shareholders is expressed by comparing its return on invested capital with its weighted average cost of capital. The gap or difference between ROIC and WACC is called the firm’s economic profit spread. Exelon’s 3-year historical return on invested capital (without goodwill) is 5.8%, which is below the estimate of its cost of capital of 7.9%. As such, we assign the firm a ValueCreation™ rating of POOR. In the chart below, we show the probable path of ROIC in the years ahead based on the estimated volatility of key drivers behind the measure. The solid grey line reflects the most likely outcome, in our opinion, and represents the scenario that results in our fair value estimate. Valuation Analysis This is the portion of our analysis that powers our opinion on a company’s shares. Below we outline our valuation assumptions and derive a fair value estimate. Our discounted cash flow model indicates that Exelon’s shares are worth between $30-$44 each. Shares are currently trading at ~$32, near the bottom of our fair value range. We feel there is more upside potential than downside risk associated with shares at this time. The margin of safety around our fair value estimate is driven by the firm’s LOW ValueRisk™ rating, which is derived from the historical volatility of key valuation drivers. The estimated fair value of $37 per share represents a price-to-earnings (P/E) ratio of about 19.7 times last year’s earnings and an implied EV/EBITDA multiple of about 9 times last year’s EBITDA. Our model reflects a compound annual revenue growth rate of -1% during the next five years, a pace that is lower than the firm’s 3-year historical compound annual growth rate of 13.2%. Our model reflects a 5-year projected average operating margin of 17.4%, which is above Exelon’s trailing 3-year average. Beyond year 5, we assume free cash flow will grow at an annual rate of 0.8% for the next 15 years and 3% in perpetuity. For Exelon, we use a 7.9% weighted average cost of capital to discount future free cash flows. (click to enlarge) (click to enlarge) Margin of Safety Analysis Each fair value estimate we provide is flanked by a margin of safety, within which we feel a company is fairly valued. Our discounted cash flow process values each firm on the basis of the present value of all future free cash flows. Although we estimate the firm’s fair value at about $37 per share, every company has a range of probable fair values that’s created by the uncertainty of key valuation drivers (like future revenue or earnings, for example). After all, if the future was known with certainty, we wouldn’t see much volatility in the markets as stocks would trade precisely at their known fair values. Our ValueRisk™ rating sets the margin of safety or the fair value range we assign to each stock. In the graph above, we show this probable range of fair values for Exelon. We think the firm is attractive below $30 per share (the green line), but quite expensive above $44 per share (the red line). The prices that fall along the yellow line, which includes our fair value estimate, represent a reasonable valuation for the firm, in our opinion. Future Path of Fair Value We estimate Exelon’s fair value at this point in time to be about $37 per share. As time passes, however, companies generate cash flow and pay out cash to shareholders in the form of dividends. The chart above compares the firm’s current share price with the path of Exelon’s expected equity value per share over the next three years, assuming our long-term projections prove accurate. The range between the resulting downside fair value and upside fair value in Year 3 represents our best estimate of the value of the firm’s shares three years hence. This range of potential outcomes is also subject to change over time, should our views on the firm’s future cash flow potential change. The expected fair value of $44 per share in Year 3 represents our existing fair value per share of $37 increased at an annual rate of the firm’s cost of equity less its dividend yield. The upside and downside ranges are derived in the same way, but from the upper and lower bounds of our fair value estimate range. Wrapping Things Up We like what mergers have done for Exelon in the past — its merger with Constellation has helped create one of the lowest-cost power generation fleets in the US — and we like the potential acquisition of Pepco. If it passes the Washington, DC regulators, it would provide the firm with undeniable market presence and pricing power in the mid-Atlantic region. The company’s dividend prospects stand to benefit from the merger as well. Its dividend has been through a rough stretch in recent years, and cash flows will need to improve dramatically to help the situation. After disappointing dividend growth investors, the company will be working hard to regain their trust. All things considered, however, the company is worth keeping on the watch list in light of its valuation. It registers a 3 on the Valuentum Buying Index . (click to enlarge) Performance In the spirit of transparency, we show how the performance of the Valuentum Buying Index, our stock selection methodology, has stacked up per underlying score as it relates to firms in the Best Ideas portfolio. To understand how we derive the VBI for each company, please download the pdf here . Past results are not a guarantee of future performance. Thank you for reading! (click to enlarge) Disclosure: I/we have no positions in any stocks mentioned, and no plans to initiate any positions within the next 72 hours. (More…) I wrote this article myself, and it expresses my own opinions. I am not receiving compensation for it (other than from Seeking Alpha). I have no business relationship with any company whose stock is mentioned in this article.
Diversified Royalty: Finally, It Is Diversified

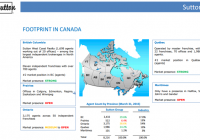
Summary Diversified Royalty transitioned from a capital pool to a royalty stream vehicle in June 2014. BEVFF took steps to prepare its capital structure to add additional royalty streams in the most cost-effective manner. Following a delay after the initial fundraising, BEVFF added a second lucrative royalty stream in early June 2015, truly diversifying itself. Diversified Royalty ( OTC:BEVFF ) (or DIV on the TSX Exchange) came into being on June 30, 2014 when a former capital pool, Benev Capital Inc., put together a transaction to acquire $12m in annual topline revenue for the purchase price of $103m ( $82m USD ) in the form of a royalty stream of income from Calgary-based Franworks Franchise Corp., the owner of the Original Joe’s, State and Main, and Elephant and Castle restaurant chains. Streaming transactions have been common in the basic materials sector for some time, utilizing with great success by Franco Nevada (NYSE: FNV ) and Silver Wheaton (NYSE: SLW ), to name a few. They serve to provide funding for business initiatives without utilizing formal debt instruments. In fact, they partially tie the vendor to the sustainability of the enterprise going forward. Due to their success in the materials sector, these transactions have gained some traction in other sectors as well, as diverse as restaurants and farming. The Franworks transaction was structured as follows: $64m ( $51m USD ) cash on hand Franworks was issued approximately 9m shares worth $14.9m ($12m USD) Maxam Opportunities LP, a venture fund, subscribed for 5.2m shares or $8.7m ($7m USD) in a private placement $15m ($12m USD) coming from borrowings Franworks’ position in DIV amounted to 16.9% of the company at the time of the deal (now 15.4% after some other transactions) so they are very vested in the success of DIV as well. Franworks has the funds from the royalty sale to accelerate growth of its brands by adding new locations, as well as by renewing older locations. Both these help to drive revenue and should provide growing royalties to DIV down the road. Franworks’ restaurants are in the “upscale, casual” dining space. This is where you pay close to upscale dining prices, but without the dress code required. Go in to any of these restaurants and you will see people dressed up for a nice night out sitting next people just off the beach in tank tops and flipflops. The margins are much better than most mass eateries while still having a broad appeal. Maxam Capital Management, the manager of the Maxam Opportunities Fund, uses an “active, opportunistic and flexible” approach to capital management. DIV’s CEO, Sean Morrisson, is also a Managing Partner at Maxam and has a very strong background in capital management, advising the Keg Restaurants, a restaurant royalty income fund in Canada (KEG.UN), among other activities in his venture capital career. Maxam is a good partner for DIV to have in expanding its business, both to generate leads as well as to help evaluate transactions initially and on an ongoing basis. The restaurant-based royalty stream transactions are quite common in Canada with several others utilizing the income fund structure, such as the A&W Revenue Royalties Income Fund (AW-UN.TO), the Boston Pizza Royalties Income Fund (BPF-UN.TO) and the Keg Royalties Income Fund (KEG-UN.TO). DIV is not setup as an income fund, which makes it more flexible to acquire new streams of income down the road, as there are some limitations with the tax structure for income funds. As well, they can simulate the tax-free structure by utilizing its $35m CAD ($28m USD) in tax losses. Like these other royalty funds, the Franworks royalty is a gross revenue royalty, earning 6% of the top-line revenue from the restaurants included in the pool. These can change over time as locations are added or subtracted. Some royalty streams are based on net revenues, where some deductions are taken prior to payment, but DIV will receive its royalty regardless of how profitably the locations are operated. That said, it is clearly to their advantage to have successful restaurants available in the future. DIV’s future is clear: The royalty acquisition from Franworks is a platform transaction for BCI and the first step in our recently announced strategy to purchase top-line royalty streams from a number of growing multi-location businesses and franchisors. Franworks is a fast growing chain with strong unit-level economics and a superb management team – key success factors for a top-line royalty acquisition. With the successful completion of this transformational transaction, BCI intends to focus its efforts on acquiring additional royalties from growing multi-location businesses and franchisors. In October 2014, DIV received final approval for the transaction and completed its name changed to Diversified Royalty Corp. This followed quickly with a promotion of the company on to the TSX big board , providing it a better avenue to raise equity funds than they would have had with a Venture Exchange listing. They quickly utilized this, closing a $34.5m bought deal financing in November 2014 ($27.6m USD). Now all they needed was another royalty stream. So shareholders waited. And waited. And waited. Message boards on stock forums complained about DIV’s lack of action. Analysts on business TV poked fun at its name “how can it be Diversified with just one royalty stream.” On April 1, 2015, DIV added 5 new restaurants to its Franworks deal, increasing annual royalties by $0.6m ($0.5m USD) annually, at a consideration of $6.2m ($5.0m) , $4.8m ($3.9m USD) payable upfront in DIV shares, valued at $2.69 CAD ($2.15 USD), with the remainder due in a year depending on performance of these locations. However, this didn’t move the needle for most shareholders. However, patience was rewarded as on June 9, 2015, DIV announced it had purchased its second royalty stream from real estate company Sutton Realty. (click to enlarge) Sutton is a very strong realtor brand in Canada and has had a relatively stable level of agents throughout the past decade, despite not having the funding available to acquire smaller brokerages or to grow organically. This transaction with DIV will allow it to jumpstart its growth, which will be a positive for both Sutton and DIV. DIV receives, in exchange for $30.6m ($24.5m USD), a fixed royalty payment for licensing the Sutton brand back to Sutton of $3.5m ($2.8m USD) annually plus a $100,000 CAD ($80,000 USD) annual management fee. The royalty payment escalates 2% each year, the management fee 10% every four years and the entire deal is for 99 years. This fee has 40% coverage by Sutton based on EBITDA so there is a good margin of safety to ensure DIV receives their fees each year. Sutton can increase the rate by 10% on four occasions during the life of the deal or choose to add additional agents to the pool in exchange for further investment by DIV based on a pre-set formula. DIV will fund this transaction using $24.3m ($19.4m USD) in cash and an additional $6.3m in debt. This will leave DIV with a roughly $10m ($8m USD) cash on its balance sheet with debt of $21m ($16.8m USD) , a small portion compared to its equity valuation and covered by its future cashflows. Going Forward In its presentation to shareholders, DIV provided the following competitor analysis and forecasted cashflow coverage: (click to enlarge) The first 5 royalty companies all are strictly food-based royalty companies, while Alaris is significantly more diversified than the others. DIV is more hedged with its two current streams than the restaurant only funds, though not as much as Alaris. Its 6.9% dividend yield is significantly higher than the mean of 5.5%. These payouts are made monthly rather than quarterly like most dividends so they are in your hands sooner. The high payout rate is common with these types of corporate structures, as shown above. In some cases, high dividends can be a sign of trouble at the company as the market doesn’t believe they are sustainable; however, in this case it is due to a lack of market awareness. DIV has only one quarter as a royalty company, and this is only with the Franworks royalty stream. However, I wanted to see if they were roughly on track. From the first quarter 2015 MD&A: While they clearly paid out more than planned in this quarter, several extra events impacted the result: $700K CAD ($560K USD) in costs associated with litigation from a former CEO (who left the company in 2004, long before the business model change) $300K ($240K USD) in financing related costs $400K ($320K USD) in taxes; the company has losses that will be applied going forward to minimize these costs. I don’t believe the 2015 first quarter excess distribution over distributable cash is a concern. DIV has undergone a very drastic transformation and will have some costs associated with this, which should normalize in the next couple of quarters. The fact that revenue delivered as expected, despite economic headwinds in the Alberta oil patch, is positive. DIV should also see some economies of scale when the Sutton royalty starts to show up in its results. DIV is not without some risk. Most of the Franworks locations are in Western Canada, which makes it somewhat susceptible to the fortunes of the oil patch; that said, Q1 gives a pretty good indication that they should not be significantly affected by this as this was when the oil price drop was most severe. The frothiness of Canadian real estate is also well known . If there were a downturn in housing, eventually you would likely see some agents take down their shingles. That said, Sutton has maintained its levels of realtors consistently over the past decade so they likely wouldn’t need to retrench much in a downturn. The coverage provided by the EBITDA levels also will ensure Sutton makes its minimum payments to DIV. DIV gives an investor diversified exposure to the Canadian consumer with steady, growing businesses that hit two of the necessities of life — food and shelter, all while receiving an above-average yield ( 6.9% ). Well worth the wait. All figures in CAD, except where indicated. Editor’s Note: This article covers one or more stocks trading at less than $1 per share and/or with less than a $100 million market cap. Please be aware of the risks associated with these stocks. Disclosure: I am/we are long BEVFF. (More…) I wrote this article myself, and it expresses my own opinions. I am not receiving compensation for it (other than from Seeking Alpha). I have no business relationship with any company whose stock is mentioned in this article.