Tag Archives: datetime-local

Too Far, Too Fast? Market Professionals Reflect Evolving Smart-Money Opinion

How good have their forecasts been? Figure 1 is the record of five years of daily forecasts for ProShares UltraPro Dow30 ETF (NYSEARCA: UDOW ), an ETF that holds derivative securities which are intended to magnify the daily percentage price changes in the DJIA index by a factor of 3 times, either up or down. Figure 1 tells what the Market-makers daily hedging-implied forecasts for UDOW over the past 5 years have produced as net profits for a wide range of imbalances between upside and downside prospects. Those imbalances are measured by the Range Index [RI] which tells what percentage of the whole forecast range lies below the market quote at the time of the forecast. Figure 1 also indicates how often the forecasts were able to produce a profitable outcome, operating in a realistic, time-constrained portfolio management discipline. Click to enlarge So what did MMs see earlier, see now? Here is the current picture of probable coming UDOW prices, along with similar once-a-week forecasts over the past 2 years. Figure 2 (used with permission) The vertical lines of Figure 2 are the price range forecasts for UDOW implied by the MM community’s hedging actions to protect firm capital exposed during buyer~seller balancing to “fill” volume trades. The forecast of 5 weeks ago was from a then-price of $46.54 and a Range Index of -11. Now it has a quote of $64.72 and a Range Index of 57. A week ago the price of $59.49 carried a RI of 51. Figure 1 suggests that buys of UDOW at today’s RI level of 57 in the past might produce only a +2% payoff from here, instead of the upwards of +12% that had been experienced by -11 Range Index forecasts earlier. The +2% prospect is reinforced by the row of data in Figure 2 as the actual payoff experience achieved in 108 of the 1261 days for which UDOW forecasts were available. Forecasts that had RIs of around 57. The current forecast is more optimistic than past experience; it projects a potential gain of +5.6% Odds for reaching the current payoff prospect remain high, with priors producing a profit in 84 of every 100 among the 108 experiences. The fact that gains better than three times the earlier forecast’s average payoff already have been experienced makes one wonder if the “other shoe might drop” any time now and markets might start to back off. To ease such concerns, it is appropriate to know as UDOW prices were rising during this past week, its MM expectations rose faster. The outlook gains pulled back RIs which on a couple of days were at 68. Continued rising expectations, at a gain rate faster than prices, will put strength under a continued market price rise, albeit at a slower pace. Failure to do so may signal weakening market enthusiasm. We’ll have to see what happens. It can be monitored on blockdesk.com., along with expectations for the VIX index and VIX-based ETFs. Disclosure: I/we have no positions in any stocks mentioned, and no plans to initiate any positions within the next 72 hours. I wrote this article myself, and it expresses my own opinions. I am not receiving compensation for it (other than from Seeking Alpha). I have no business relationship with any company whose stock is mentioned in this article.
Miles Capital Launches Fund Of Alternative Funds

The recently launched Miles Capital Alternatives Advantage Fund has an interesting approach to multialternative investing: it gains its exposures by bundling other alternative mutual funds and ETFs. The fund, which launched on March 14, is available in N (MUTF: MILNX ) and I (MUTF: MILIX ) share classes, with respective net-expense ratios of 3.24% and 2.99% (this includes 1.24% of acquired fund fees from the underlying funds), and initial investment minimums of $2,500 and $50,000. Allocation Across Multiple Strategies The Miles Capital Alternative Advantage Fund’s investment objective is to provide long-term capital returns with less volatility than U.S. equity markets. It pursues this end by means of investing in mutual funds and ETFs employing the following strategies: Long/short equity Long/short credit Market neutral Arbitrage Global macro Moreover, the fund may invest in mutual funds and ETFs that bundle alternative assets, in addition to strategies. These assets may include commodities and commodity-linked instruments, currencies, real estate and other real assets, and illiquid private placements and distressed assets. For more information, read the fund’s prospectus . Fund of Funds Approach Although the “fund of funds” approach is common among hedge funds, “funds of alternative mutual funds and ETFs” are less so. Still, the Miles Capital Alternatives Advantage Fund isn’t the first. Three of the best performing funds from the group that came before it include: Of the three, CAALX is the largest in terms of assets under management (“AUM”), at $460 million. LPTAX was second, at $227 million AUM; while GASAX was the smallest, at $90 million AUM. How have these “funds of alternative funds” performed? In terms of their 3-year returns through February 29, CAALX was tops at +3.76%, which was good enough to rank in the top 7% of Morningstar’s Multialternative category. LPTAX’s 3-year returns stood at 2.73%, which put it in the top 15%. And GASAX returned 2.05% for the 3-year period ending Leap Day 2016, putting it in the top 23% of its peers. Past performance does not necessarily predict future results. Jason Seagraves contributed to this article.

Does Market Volatility Favor Active Management?

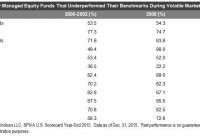
By Aye Soe Twice a year, S&P Dow Jones Indices releases the SPIVA U.S. Scorecard. The scorecard measures the performance of actively managed equity and fixed income funds across various categories. Since the initiation of the report in 2002, the results have consistently shown that managers across most categories overwhelmingly underperform on a relative basis against their corresponding benchmarks over a medium-to-long-term investment horizon. The Year-End 2015 SPIVA U.S. Scorecard reveals little surprise. The second half of 2015 was marked by significant market volatility, which was brought forth by plunging commodity prices, a strengthening U.S. dollar, growing global concerns over Chinese economic growth, and the subsequent devaluation of the Chinese renminbi. Market volatility, in theory, favors active investing, because managers can tactically move out of their positions at their discretion and park themselves in cash. Passive investing, on the other hand, has to remain fully invested in the market. Investors in actively managed strategies should therefore realize fewer losses during periods of heightened volatility, all else being equal. Given this theoretical background, recent volatility in the market has supporters of active investing proclaiming that active management is back in favor. However, over a decade of experience in publishing the SPIVA Scorecard has painfully taught us that active funds don’t always perform better than their passive counterparts during those precise periods in which active management skills seem to be called for. Exhibit 1 compares the performance of actively managed equity funds across the nine style boxes during the 2000-2002 bear market, the financial crisis of 2008, and 2015. As the data clearly show, there is no consistent pattern across most of the categories. Large-cap value managers appear to be the only exception to the losing trend, outperforming their benchmark in both bear markets. Again in 2015, mid-cap value is the only winning equity category, with the majority (67.65%) of them outperforming the S&P MidCap 400® Value . Disclosure: © S&P Dow Jones Indices LLC 2015. Indexology® is a trademark of S&P Dow Jones Indices LLC (SPDJI). S&P® is a trademark of Standard & Poor’s Financial Services LLC and Dow Jones® is a trademark of Dow Jones Trademark Holdings LLC, and those marks have been licensed to S&P DJI. This material is reproduced with the prior written consent of S&P DJI. For more information on S&P DJI and to see our full disclaimer, visit www.spdji.com/terms-of-use .