Tag Archives: conservative

AusNet Should Not Be Bought By Conservative Investors

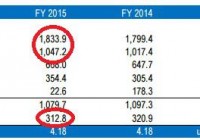
Summary AusNet has been a steady dividend payer but it actually cannot afford the dividend as in the past two financial years it had to borrow cash to cover the dividend. Despite considering half of the capex as ‘growth’ capex, there won’t be a clear revenue increase further down the road. I consider my investment profile to be a bit too conservative to invest in AusNet right now as it isn’t self-funding the dividend (if you include growth capex). Introduction AusNet Services ( OTCPK:SAUNF ) operates a gas and electricity distribution network in Melbourne and Victoria (Australia) as well as high voltage power lines supplying Victoria. The company is known for its relatively generous dividend payments, but in this article I will discuss whether or not these dividends are sustainable. AusNet is an Australian company and you should trade in AusNet shares on the Australian Stock Exchange for liquidity reasons as the average daily dollar volume is almost $4M. The stock’s ticker symbol in Australia is AST . Is AusNet spending too much cash on dividends? In order to answer this question, we obviously need to have a closer look at the company’s financial situation, so we will focus on the results of its financial year 2015 (the most recent numbers available to the general public). Source: press release At first sight, AusNet had a pretty decent year as its revenue increased by 1.9%, resulting in a 2.9% increase in its EBITDA to just over A$1B. You immediately notice the strong EBITDA conversion as in FY 2015, no less than 57% of the company’s revenue was converted into EBITDA, which is pretty strong! However, this trend was discontinued at the bottom line as AusNet’s (adjusted) net profit decreased by approximately 2.5%. But of course, net profits and net losses don’t have any importance when you’re trying to find out whether or not a company can afford its dividend policy and that’s why I will switch to the company’s cash flow statements. AusNet generated an operating cash flow of A$768M (a very nice increase compared to the A$730M last year), but unfortunately the company had to spend A$800M in capital expenditures resulting in a negative free cash flow of almost A$40M (US$30M). So there wasn’t any free cash flow, but AusNet decided to spend A$180M (US$135M) in dividend distributions anyway. That’s not a good sign. Source: financial statements But okay, maybe this was a one-time bump in the road, so let’s pull the 2014 numbers as well. In the previous financial year, AusNet generated A$730M in operating cash flow but spent A$925M on capital expenditures, so AusNet hasn’t had a positive free cash flow in two financial years, but nevertheless decided to reward its stakeholders by paying out cash dividends to the tune of US$330M (keep in mind this does NOT include the additional dilution caused by shareholders accepting their dividend in new shares. If everybody would have elected a cash payment, the cash outflow would even be $100M higher!). This cash shortfall was compensated by issuing more debt. Why I’m not interested in buying AusNet at the current valuation I’m obviously not narrow-minded nor short-sighted (at least, I try not to be), and it does look like AusNet’s future will improve a bit as its capital expenditures are coming down. This should be the last year of heavy capex investments (estimated at A$900M), but from FY 2017 on the capital expenditures should be reduced to A$725M per year. Taking an expanding operating cash flow into consideration, this means I would expect AusNet to generate a positive free cash flow but his will be insufficient to cover the current 6% dividend yield. There’s an additional reason why I’m not very keen on adding AusNet to my portfolio. It’s quite common for utilities companies to have a lot of debt on its balance sheet and AusNet isn’t any different. As of at the end of March it had A$5.8B in net debt. That shouldn’t be a huge problem given the strong operating cash flows and EBITDA (and as said, it’s very normal for a company in this segment to have an above-average net debt). However, if you’d look at the cost of this debt, you’d be surprised at how this leverage could kill this company. AusNet paid A$326M in finance costs, so let’s now assume its average interest rate it has to pay is approximately 5%. If the average cost of debt would increase by 1%, AusNet’s bill would increase by A$50M and this will have a further negative impact on its ability to generate a positive free cash flow. But I don’t want to be too negative I always get a little bit nervous when I see a company telling its shareholders ‘the dividend is fully backed by the operating cash flow’. Whilst this is essentially true, I prefer to look at the free cash flow/dividend ratio. Whilst this is ratio is negative in AusNet’s case, there is also something working in its favor. (click to enlarge) Source: company presentation Of the A$800M it spent on capex in FY 2015, only A$380M was maintenance capex whilst the remaining A$420M capex was spent on projects to ensure further growth. However, looking at the average analyst estimates , there’s no clearly visible increase in the revenue expected within the next few years so even though A$420M is being spent on ‘growth’, I’m cautious until I indeed see a revenue increase. Investment thesis AusNet is paying a handsome dividend – which it promises to increase once again this year – but it’s only able to afford the dividend by raising additional cash through issuing more debt and that’s a dangerous game to play. I’m fine with AusNet spending A$420M on ‘growth’, but it’s a bit disappointing the company hasn’t released updated revenue growth targets for the next few years so it’s difficult to check if the ‘growth capex’ is really paying off. Don’t get me wrong, I’m not saying AusNet is a bad company, not at all. But I personally wouldn’t feel comfortable with a continuously increasing net debt profile which has the potential to erode the majority of the future free cash flow should the interest rates increase (which isn’t really unlikely). Editor’s Note: This article discusses one or more securities that do not trade on a major U.S. exchange. Please be aware of the risks associated with these stocks. Disclosure: I/we have no positions in any stocks mentioned, and no plans to initiate any positions within the next 72 hours. (More…) I wrote this article myself, and it expresses my own opinions. I am not receiving compensation for it (other than from Seeking Alpha). I have no business relationship with any company whose stock is mentioned in this article.
Bottom-Digging During Market Tops

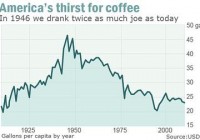
Summary Finding investing opportunities when the market reaches all-time highs. What industries currently offer value in the market. Managing your portfolio. The S&P 500 has nearly tripled from a 2009 low of 735 to 2113 currently. Just as a rising tide lifts all ships, so too does a rising stock market lift all stocks. At greedy times like these, investors should be fearful and reexamine their portfolios. …if [investors] insist on trying to time their participation in equities, they should try to be fearful when others are greedy and greedy only when others are fearful. -Warren Buffett Now, I’m not saying the market has reached its peak (though some do make compelling arguments ). I am not a market timer. I’ve written about the folly of forecasting in the past. I’m merely saying a prudent investor should not let greed get the better of him. The following strategy is one that is more likely to be applicable during market highs as investors are more likely to have a preponderance of stocks trading at prices much higher than their actual values (aka, the rising tide theory mentioned above). So what to do? Well, I believe the prudent investor should lock in gains on stocks pushing well beyond their valuations (close to 52-week or all-time highs) and replace them with stocks trading at reasonable valuations. Mr. Market is offering attractive prices for your stocks, let him have them. But then we’re left with the problem of finding alternative investments. As markets keep pushing higher and higher, investors are often left scratching their heads wondering where to find value. Admittedly, this can be challenging, however, opportunities do still exist. One place to look as stocks reach all-time highs are stocks reaching new 52-week lows. Some noteworthy examples include PriceSmart (NASDAQ: PSMT ), SodaStream (NASDAQ: SODA ), Turtle Beach Corp. (NASDAQ: HEAR ), and Fossil (NASDAQ: FOSL ). PriceSmart is the Sam’s Club of Central America and the Caribbean. It’s trading at a small discount to its sales, has high insider ownership, and has consistently grown sales, 15% on average, over the past ten years. At its current price of $17.07 after-market, SodaStream trades at a large discount to sales (72% of sales) and is nearly trading at its book value of $16.59. Turtle Beach has near-total domination in the gaming headphone market with 50% of both the UK and US markets. It trades at 60% of sales (which it looks to nearly double sales this year) and is led by smart management with a solid near-term plan, and patents, to enter industries such as health, automotive, TV and mobile. I’ve already written my take on Fossil, you can read it here . The next place to look is at overlooked stocks (often smaller capitalization, less than $100m) in industries where there is a low supply of investment opportunities. One such industry is the coffee industry. Now, before going into individual companies, let me preface this discussion by first noting some interesting dynamics at place in this market. For one, coffee consumption is not nearly what it used to be. In fact, in 1946 consumers drank 46.4 gallons of coffee per person ( Figure 1 ). Today, even with a coffee shop on every corner, consumers drink less than half as much at only 20-25 gallons of coffee per year as coffee was replaced predominantly by soda. As consumers become more health-conscious, pop consumption should decrease and coffee, as a viable, healthy alternative, should have an increased level of consumption. Secondly, there is a shift taking place where high-quality shade-grown coffee (high cost to grow) is being overtaken by the rise of poorer quality shade-free coffee (cheaper to grow). This makes coffee plants much more susceptible to climate change and topsoil erosion. As climate change concerns begin to grow, the downfall we’ve seen in coffee prices from $300 in 2011 to a current 52-week low of $140 is not likely to last. Figure 1 Now, opportunities in this market surely exist in the form of large companies. There is, of course, Green Mountain Coffee Roasters (NASDAQ: GMCR ) and Starbucks (NASDAQ: SBUX ), but investors in those companies will soon bail when they see these companies for what they are-overvalued. Starbucks trades at an all-time high ($94.30) and the highest price-to-sales ratio it has ever seen in the last ten years of 4.12. Starbucks also trades inversely to coffee prices. Green Mountain Coffee Roasters ($124.10) shares trade even higher at a price-to-sales of 4.31 and, like Starbucks, it is also inversely correlated to coffee prices. As coffee prices rise investors will bail on these two companies (and valuations will come back down to earth). So when investors bail, where will they look? On the conservative end is Coffee Holding Co. (NASDAQ: JVA ), trading at 28% of its total sales. This company is well-managed by its owners, experienced coffee industry veterans who have a 10% stake in the company’s shares. They also support and believe in sustainable practices. These beliefs lead to production of higher quality coffee (shade grown) that is not as susceptible to soil erosion and climate change. Furthermore, as experienced coffee experts, they are well-hedged against fluctuating prices. On the risky end is Jammin Java ( OTCQB:JAMN ), better known by its Marley Coffee, which is trying to force itself to turn things around before it does a complete nose-dive. If company-estimated year-end sales are to be believed, the company trades at a 10% discount to expected year-end sales. However, this company is only for high-risk-oriented individuals who don’t mind getting cleaned out if things turn south. Then, there’s the oil industry. I don’t think I need to go into this as many have already witnessed the price collapse at the pumps, so suffice it to say that there are many opportunities to be had in this sector, both large cap and small, and everything in between. (Check out Cale Smith’s recent notes about the oil price phenomenon). I’m pretty sure you could throw 10 darts at oil stocks right now and make at least 8 solid investments. Another interesting idea is James O’Shaughnessy’s strategy of looking for stocks that he calls Reasonable Runaways . These are stocks that have a high relative strength, greater than $150m in market cap and trade at a price-to-sales ratio less than 1. I’ve modified this strategy a little bit by including companies that have large amounts of cash in excess of debt. Some notable examples include FreightCar America Inc. (NASDAQ: RAIL ), BeBe Stores (NASDAQ: BEBE ), Men’s Wearhouse (NYSE: MW ), LSI Industries (NASDAQ: LYTS ) and FujiFilm Holdings ( OTCPK:FUJIY ). While I have not had time to look into each of these companies it doesn’t matter- the theory of the Reasonable Runaways strategy is one of investor agnosticism. The theory says that you are buying $1 worth of sales for less than a dollar (low P/S) just as investors are realizing the company is undervalued (high relative strength). You simply run the screen, buy agnostically, and diversify your portfolio by giving equal weight to the top 20 or so companies with the highest price appreciations. Sell after a year then repeat the process. Since 1951 this strategy had a compound annual growth rate of over 18%. While the S&P 500 may have reached its top, your portfolio doesn’t have to top out. You can simply shift your current best performers to companies that offer greater opportunity and more attractive valuations. Employing several different search techniques, such as those mentioned above, can get you on the right track to optimizing your portfolio towards value and thus reducing your overall risk by increasing your margin of safety. But don’t forget to hold on to a fair amount of just in case cash for when the market does plummet. You’ll want to have that cash in your back pocket to snatch up undervalued companies when the falling tide lowers all the ships again and more opportunities abound. Editor’s Note: This article covers one or more stocks trading at less than $1 per share and/or with less than a $100 million market cap. Please be aware of the risks associated with these stocks. Disclosure: The author is long FOSL, JVA. (More…) The author wrote this article themselves, and it expresses their own opinions. The author is not receiving compensation for it. The author has no business relationship with any company whose stock is mentioned in this article.
ETFReplay.com Portfolio For January

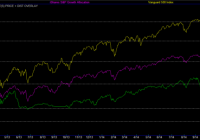
The ETFReplay.com Portfolio holdings have been updated for January 2015. I previously detailed here and here how an investor can use ETFReplay.com to screen for best performing ETFs based on momentum and volatility. The portfolio begins with a static basket of 15 ETFs. These 15 ETFs are ranked by 6 month total returns (weighted 40%), 3 month total returns (weighted 30%), and 3 month price volatility (weighted 30%). The top 4 are purchased at the beginning of each month. When a holding drops out of the top 5 ETFs, it will be sold and replaced with the next highest ranked ETF. Starting in 2015, the basket of 15 ETFs will be reduced to 14 in order to further simplify the strategy. PowerShares DB Agricultural Commodities (NYSEARCA: DBA ) has been removed. The 14 ETFs are listed below: Symbol Name RWX SPDR DJ International Real Estate PCY PowerShares Emerging Mkts Bond WIP SPDR Int’l Govt Infl-Protect Bond EFA iShares MSCI EAFE HYG iShares iBoxx High-Yield Corp Bond EEM iShares MSCI Emerging Markets LQD iShares iBoxx Invest Grade Bond VNQ Vanguard MSCI U.S. REIT TIP iShares Barclays TIPS VTI Vanguard MSCI Total U.S. Stock Market DBC PowerShares DB Commodity Index GLD SPDR Gold Shares TLT iShares Barclays 20+ Year Trsry SHY iShares Barclays 1-3 Year Treasry Bnd Fd In addition, ETFs must be ranked above the cash-like ETF SHY in order to be included in the portfolio, similar to the absolute momentum strategy I profiled here . This modification could help reduce drawdowns during periods of high volatility and/or negative market conditions (see 2008-2009), but it could also reduce total returns by allocating to cash in lieu of an asset class. The top 4 ranked ETFs based on the 6/3/3 system as of 12/31/14 are below: 6mo/3mo/3mo TLT iShares Barclays Long-Term Trsry LQD iShares iBoxx Invest Grade Bond VNQ Vanguard MSCI U.S. REIT SHY Barclays Low Duration Treasury For January, 50% of our current position in SHY will be sold and the proceeds used to purchase VNQ. The strategy continues to hold TLT, LQD, and a reduced position in SHY. Beginning in 2014, we track both the 6/3/3 strategy (same system as 2013) as well as the pure momentum system, which will rank the same basket of 15 (now 14) ETFs based solely on 6 month price momentum. There is no cash filter in the pure momentum system, volatility ranking, or requirement to limit turnover – the top 4 ETFs based on price momentum will be purchased each month. The portfolio and rankings will be posted on the same spreadsheet as the 6/3/3 strategy. The top 4 six month momentum ETFs are below: 6 month Momentum TLT iShares Barclays Long-Term Trsry VNQ Vanguard MSCI U.S. REIT VTI Vanguard Total U.S. Stock Market LQD iShares iBoxx Invest Grade Bond The 6 month momentum system maintains positions in TLT, VNQ, and VTI. PCY will be sold and the proceeds used to purchase LQD. Below is a 2-year equity curve for the conservative strategy: (click to enlarge) Below is a 1-year equity curve for the aggressive strategy: (click to enlarge) Disclosures: None