Tag Archives: colombia

Tactical Allocation: The Best Asset Categories Now

Summary Tactical allocation strategies use relative strength rankings to select asset categories. They often have a filter excluding those which are technically in a bear market. Here is the list of asset categories passing such a filter now. Tactical allocation strategies aim at selecting assets based on a relative strength ranking. They can easily be implemented with ETFs. The set of assets may be global (main asset classes), focused on a specific asset class, on a geographical classification in equities (regions, countries), or on sectors. The relative strength ranking is generally based on price action and technical indicators (momentum, risk-adjusted performance, volatility). Tactical quantitative models are most of the time designed to detect and follow the trends. They often have a better risk-adjusted performance when they include market-timing rules excluding the assets that are in a bear market. All is about the definition of what a “bear market” is. Practically, we use moving averages. A bearish signal is posted when the price falls below a long-term moving average (for example 200 days, 10 months, 1 year), or when a short-term moving average (for example 1 week, 1 month, 50 days) falls below a long-term moving average. For some models, the signal must be confirmed during a number of days to limit the risk of whipsaw. I run several models of this kind. Here is the list of ETFs that still pass a double filter: last closing price and the 50-day moving average must be both above the 200-day moving average (date: 9/15 on close ). This double filter, named hereafter “no-bear” filter, is an example that does not correspond exactly to what I am using in the models, and global timing rules may also exclude all long equity ETFs in the list at some times. Moreover, models keep only the top-ranked ETFs regarding the relative strength factor. Global Assets model Possible Holdings: Dollar Index (NYSEARCA: UUP ), 7-10 year US T-bonds (NYSEARCA: IEF ), 20+ year US T-bonds (NYSEARCA: TLT ), emerging market bonds ((NYSEARCA: PCY ), (NYSEARCA: EMB )), international sovereign bonds ex-U.S. (NYSEARCA: WIP ), the U.S. stock market (NYSEARCA: SPY ), developed countries stock markets ex-U.S. and Canada (NYSEARCA: EFA ), Latin America stock markets (NYSEARCA: ILF ), Pacific region stock markets ex-Japan (NYSEARCA: EPP ), U.S. real estate (NYSEARCA: ICF ), commodities (NYSEARCA: DBC ). Passing the “no-bear” filter: none Equities by Countries model Possible Holdings: U.S., Canada (NYSEARCA: EWC ), Russia (NYSEARCA: RSX ), Japan (NYSEARCA: EWJ ) China (NYSEARCA: FXI ), Europe (NYSEARCA: IEV ), Sweden (NYSEARCA: EWD ), Germany (NYSEARCA: EWG ), Hong-Kong (NYSEARCA: EWH ), South Africa (NYSEARCA: EZA ), Indonesia (NYSEARCA: IDX ), Thailand (NYSEARCA: THD ), South Korea (NYSEARCA: EWY ), Taiwan (NYSEARCA: EWT ), Malaysia (NYSEARCA: EWM ), Vietnam (NYSEARCA: VNM ), Brazil (NYSEARCA: EWZ ), Mexico (NYSEARCA: EWW ), Chile (NYSEARCA: ECH ), Colombia (NYSEARCA: GXG ), Peru (NYSEARCA: EPU ). Not all countries ETFs are included in the model for various reasons (liquidity, correlations). Passing the “no-bear” filter: none. U.S. Sectors and Industries Possible Holdings: Utilities (NYSEARCA: XLU ), Energy (NYSEARCA: XLE ), oil & gas exploration and production (NYSEARCA: XOP ), Financials (NYSEARCA: XLF ), healthcare (NYSEARCA: XLV ), Industrials (NYSEARCA: XLI ), technology (NYSEARCA: XLK ), Consumer staples (NYSEARCA: XLP ), home construction (NYSEARCA: ITB ), biotechnology (NASDAQ: IBB ), REITs , retail (NYSEARCA: RTH ), semi-conductors (NYSEARCA: SMH ), MLPs (NYSEARCA: AMLP ), internet (NYSEARCA: FDN ), solar energy (NYSEARCA: TAN ). Not all industry ETFs are included in the model because of liquidity filters, redundancy or other reasons. Passing the “no-bear” filter: FDN (internet), IBB (biotechnology), RTH (retail), ITB (home construction). Bond model Possible Holdings: core U.S. aggregate (NYSEARCA: AGG ), PIMCO total return (NYSEARCA: BOND ), Convertibles (NYSEARCA: CWB ), high yield (NYSEARCA: JNK ), 1-3 year T-bonds (NYSEARCA: SHY ), 3-7 year T-bonds (NYSEARCA: IEI ), 7-10 year T-bonds , 10-20 year T-bonds (NYSEARCA: TLH ), 1-5 years corporate bonds (NASDAQ: VCSH ). Passing the “no-bear” filter: ( SHY ), ( IEI ) (1-7 year T-bonds), ( VCSH ) (1-5 years corporate bonds). Conclusion The asset categories that still look good now from a tactical allocation point of view are short-term bonds (U.S. government and corporate, under 7 years of maturity) and equities in a few U.S. industries: internet, biotechnology, retail, home construction. Please note that these tactical allocation models are not a part of my subscription service , which is focused on a 20-stock defensive portfolio with hedging tactics based on a systemic risk indicator. Disclosure: I/we have no positions in any stocks mentioned, and no plans to initiate any positions within the next 72 hours. (More…) I wrote this article myself, and it expresses my own opinions. I am not receiving compensation for it. I have no business relationship with any company whose stock is mentioned in this article. Additional disclosure: I short the S&P 500 for hedging purposes.
Oil Price Impact On Single Country ETFs

Single country ETFs demonstrate widely varying dependence on oil price. Canadian, Columbian, Norwegian and Russian ETFs are the most correlated to USO. Chinese and Indian ETFs are among the least correlated. In a recent article about primary beneficiaries of a potential oil price rebound, Zacks Funds identified Russia, Malaysia and UAE with their respective ETFs as the ones that could make a turnaround if the oil price makes a sustained move higher. This prompted me to look at a wider universe of single country ETFs and investigate their performance dependency on oil price. For this exercise I compiled a list of 45 US listed single country ETFs. All of the funds are market cap weighted and I did my best to pick the ETFs with the highest assets under management (AUM) for each country. I then obtained correlation estimates with the United States Oil Fund ETF (NYSEARCA: USO ) using a free online tool InvestSpy. Below is a full results table, calculated utilizing 1 year of historical data: There are a few observations to be made from the correlation coefficients above: It turns out that the most correlated ETFs with the recent oil price movement were the iShares MSCI Canada ETF (NYSEARCA: EWC ), the Global X MSCI Colombia ETF (NYSEARCA: GXG ), the Global X MSCI Norway ETF (NYSEARCA: NORW ) and the Market Vectors Russia ETF (NYSEARCA: RSX ). Each of these four ETFs had a correlation coefficient above 0.50 with USO, which is a relatively high number in the cross-asset class dimension. This probably does not come as a big surprise given that all four economies are significant oil exporters as can be seen from the interactive map provided by The Economist. So in a search for country ETFs that could benefit from rising oil price, these would be the first options I would consider. Some of the countries that one would expect to find at the top of the list are not there. One part of the explanation is that there are a lot of major oil countries without an ETF targeting local stocks. This includes Saudi Arabia, Iran, Iraq, Venezuela and a number of African countries. However, some other key oil exporters like UAE, Qatar and Nigeria make appearance outside the top 10. I believe a big reason for this is the iShares MSCI UAE Capped ETF (NASDAQ: UAE ), the iShares MSCI Qatar Capped ETF (NASDAQ: QAT ) and the Global X Nigeria Index ETF (NYSEARCA: NGE ) were launched only 1-2 years ago and have seen only a limited interest from investors thus far. None of them has more than $50 million in AUM and liquidity is subpar, therefore prices can be stale, consequently pushing down the correlation with other securities. This is something investors should take into account before making an investment decision. Finally, I thought it would be interesting to take a closer look at the countries at the bottom of the list, i.e. the ones least correlated with oil price. It was somewhat unexpected to see China and India at the very bottom of the list. But both countries are net importers of oil, generally benefiting from lower oil prices, which pushes correlation coefficients for the iShares China Large-Cap ETF (NYSEARCA: FXI ) and the iShares MSCI India ETF (BATS: INDA ) against USO lower. For investors with a stronger view on oil outlook, this can be a differentiating factor when comparing developing countries as potential investments. If you have more observations from the correlations table in this article, feel free to share them in the comments to facilitate further discussion. Disclosure: I/we have no positions in any stocks mentioned, and no plans to initiate any positions within the next 72 hours. (More…) I wrote this article myself, and it expresses my own opinions. I am not receiving compensation for it (other than from Seeking Alpha). I have no business relationship with any company whose stock is mentioned in this article. Share this article with a colleague

The Global X MSCI Colombia ETF: Rebound From 52-Week Lows

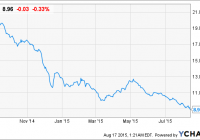
Summary Colombia is projected to have the highest Annual GDP Growth in Latin America in the next 12 months. The Global X MSCI Colombia ETF is trading below its book value and is also trading at its 52 week low. The fund has witnessed a sharp decline in its price since 2014, yet financial performance of the fund’s top 10 holdings during this year was favorable. General exposure to this ETF is a wise endeavor, while specifically investing in the banking industry may be wiser, due to its lower valuation and superior financial performance during 2014. Given the current low oil price environment, Colombia is certainly a country worth investigating for a potential rebound, as the Global X MSCI Colombia ETF (NYSEARCA: GXG ) has witnessed a sharp decline in price since September 2014; the fund reached a high of 20.78 around this time and is now trading at 8.96. Despite the risks associated with its economy being dependent on oil exports, and the fact that it has had the highest political risk among countries in Latin America, there are still ample opportunities to be found after investigating the valuation and current price of this ETF; the fund is trading below its book value and is also trading at its 52 week low. Moreover, Colombia has been among one of the fastest growing countries in Latin America, and has the highest economic growth projections for the next twelve months. GXG data by YCharts Global X MSCI Colombia ETF The fund has been consistently declining since 2014, and is extremely far from its 52 week high of 20.78. The recent decline in the price of oil has attributed to a drop in the fund’s price, and has consequently created attractive valuation : P/E ratio: 15.91 P/B ratio: 0.92 P/S ratio: 1.01 The fund’s holdings are extremely diverse, and invest into the following industries: Financial Services: 36.74% Basic Materials: 16.85% Utilities: 16.46% Industrials: 6.66% Economic Outlook Colombia has a favorable economic outlook for the next twelve months, and will lead Latin America in Annual GDP Growth. The following projections have been made for the 2nd quarter of 2016 Annual GDP Growth will increase from 2.8% to 3.2%. Inflation will remain near 4.4%. Exports will decrease by 3.1%. FDI will increase by 22.9%. Crude oil production will decrease by 0.7%. Retail sales will increase by 4.42%. Consumer spending will increase by 3.2%. Consumer credit will increase by 10.4%. Overall economic projections for the next twelve months appear to be very favorable for the country, with slight Annual GDP growth projected for the next twelve months. An increased trend of consumption and retail sales is projected for the next twelve months, which will further attribute to economic growth. Most important to note, is that the low oil price environment has not deterred FDI, as this is projected to increase by 22.9% during the next 12 months. Latin America Annual GDP Growth Comparison Recently Colombia has had the highest Annual GDP Growth, and is on track for higher economic growth during the next twelve months. While Peru and Chile have ample potential for long term recovery due to the current adverse impact of low commodity prices, a twelve month outlook provides the most favorable results for Colombia. Annual GDP Growth 2012 2013 2014 Current 2nd Quarter 2016 Projections Colombia 4 4.9 4.6 2.8 3.2 Peru 6 5.8 2.4 1.7 2.03 Argentina 0.8 2.9 0.5 1.1 0.76 Chile 5.5 4.2 1.9 2.41 2.37 Brazil 1.8 2.7 0.1 -1.6 -0.3 Source: World Bank Top 10 Holdings Overall, the financial performance of the fund’s top ten holdings has been exceptional, which makes the fund’s sharp drop in price somewhat undeserved. The fund’s holdings had a 10.6% increase in net revenue and a 10.8% increase in net income. An industry specific approach provides a mixed outlook regarding valuation and financial performance: The banking industry can be considered superior, due to its extremely attractive valuation and having exceptional growth. The utilities industry also had exceptional growth, and its valuation is relatively attractive. The consumer products industry has relatively attractive valuation, but experienced negligent growth. Increased projections for consumer spending will be a positive driver for future growth. The construction industry had substantial growth, but also has extremely high valuation. For risk seeking investors, the main holding in the oil industry has low valuation, although financial performance was not favorable in 2014. Value Based Approach Ecopetrol S.A and Bancolombia SA are two options for valued based investors to gain exposure to Colombia, as both companies have lower valuation than the ETF. Bancolombia SA’s historical P/E has been exceptionally higher in the past, with a five year P/E high of 38.61 . The banking industry holdings in the fund were among the top performing, and Bancolombia SA is a superior pick considering its net income increased by 24% while the fund’s price dropped substantially. Ecopetrol SA is a riskier pick as its net income and net revenue have been consistently declining since 2012, and sole exposure to this industry may be risky. However, valuation is the lowest of the fund’s top 10 holdings. Conclusion Now is an strategic moment for investors to gain access to Colombia’s growth, which is set to outpace other countries in Latin America during the next twelve months. The low oil price environment has created attractive valuation for the Global X MSCI Colombia ETF, which is further edified by the projected growth for Colombia. General exposure to this ETF is a wise endeavor, while specifically investing in the banking industry may be wiser, due to its lower valuation and superior financial performance during 2014. Disclosure: I/we have no positions in any stocks mentioned, and no plans to initiate any positions within the next 72 hours. (More…) I wrote this article myself, and it expresses my own opinions. I am not receiving compensation for it (other than from Seeking Alpha). I have no business relationship with any company whose stock is mentioned in this article.