Tag Archives: chemist

Has Monthly Resetting Helped Or Hurt The ETRACS 2x Leveraged ETNs?

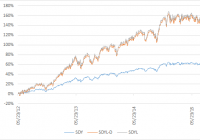
Summary The UBS ETRACS line-up of ETNs includes a number of 2x leveraged funds. The use of leverage allows the ETNs to offer higher yields, but may also increase their propensity for decay or slippage during volatile periods. The ETRACS ETNs reset their leverage monthly, has this helped or hurt their performance? Introduction The UBS (NYSE: UBS ) ETRACS line-up of ETNs cover a broad range of investment classes, including traditional equity as well as alternative investment types such as real estate investment trusts [REITs], mortgage REITs [mREITs], master limited partnerships [MLPs], business development companies [BDCs] and closed-end funds [CEFs]. A number of the ETRACS ETNs are 2x leveraged, which means that they seek to return two times the total return of the underlying index, minus fees. This allows the ETNs to offer sometimes mouth-wateringly high headline yields, making them attractive for income investors. Moreover, some of these funds offer monthly (albeit sometimes lumpy) distributions. A recent article provides an overview of the types, yields and expense ratios of these 2x leveraged ETNs. An interesting feature of the 2X leveraged ETNs is that their leverage resets monthly rather than daily, which is the norm for most leveraged funds in the market. It is well known that decay or slippage in leveraged funds will occur when the underlying index is volatile with no net change over a period of time. This “beta-slippage” has been addressed by Seeking Alpha author Fred Picard in an article entitled ” What You Need To Know About The Decay Of Leveraged ETFs “. However, by resetting monthly rather than daily, the decay of the ETRACS ETNs might be somewhat mitigated. Seeking Alpha author Dane Van Domelen has also conducted both theoretical and empirical research into the performance of leveraged funds. His research showed that in most cases, the decay is not as serious as is often initially thought to be. A subsequent article using data from 1980 to 2015 showed that monthly resetting was superior to daily resetting for a 2x leveraged version of S&P 500. This article seeks to directly address the monthly vs. daily resetting issue for a number of the ETRACS 2x leveraged ETNs. Has monthly resetting helped or hurt the ETNs compared to the equivalent daily resetting fund? Methodology The five ETNs chosen for this analysis are shown in the table below, together with their yields, inception date, volume, total expense ratio and corresponding 1x leveraged fund. For details for how the total expense ratio is calculated, please see my previous articles ( I , II ). Fund Ticker Yield Inception Volume TER* 1X Alternative Monthly Pay 2xLeveraged S&P Dividend ETN (NYSEARCA: SDYL ) 5.43% 5/2012 1.8K 1.01% SPDR Dividend ETF (NYSEARCA: SDY ) 2xMonthly Leveraged Long Alerian MLP Infrastructure Index ETN (NYSEARCA: MLPL ) 15.02% 7/2010 103K 1.16% Alerian MLP Infrastructure Index ETN (NYSEARCA: MLPI ) 2xLeveraged Long Wells Fargo Business Development Company Index ETN (NYSEARCA: BDCL ) 20.24% 5/2011 164K 1.16% Wells Fargo Business Development Company ETN (NYSEARCA: BDCS ) Monthly Pay 2xLeveraged Mortgage REIT ETN (NYSEARCA: MORL ) 26.52% 10/2012 289K 1.11% Market Vectors Mortgage REIT Income ETF (NYSEARCA: MORT ) Monthly Pay 2xLeveraged Closed-End Fund ETN (NYSEARCA: CEFL ) 22.04% 12/2013 150K 1.21% YieldShares High Income ETF (NYSEARCA: YYY ) * Includes 3-month LIBOR (currently 0.31%). Those five funds were chosen because they represent some of the more popular ETRACS ETNs, and also because they have existed for sufficient duration to be analyzed. The historical data for both the 2x and 1x leveraged funds were downloaded from Yahoo Finance . Using data for the 1x leveraged fund, I then reconstructed the price history for a hypothetically 2x leveraged fund that resets daily instead of monthly. The normalized price history for the three funds, i.e. the 1x leveraged fund, the (hypothetical) daily-reset 2x leveraged fund and the (actual) monthly-reset 2x leveraged fund are then plotted on the same graph, as shown below. SDYL The first example shown is SDYL, 2x high-dividend equity fund. Since inception in May 2012, the corresponding 1x fund SDY has returned 63.6%, while the 2x SDYL has returned 161.0%, which is over twice that of the 1x fund (the actual number is 2.53 times). This illustrates the powerful compounding of leverage that takes place when the underlying asset moves strongly in one direction with little volatility. Additionally, we observe that the hypothetical daily-resetting SDYL (SDYL-D) has a very similar price history to the actual, monthly-resetting SDYL. SDYL-D ended up with a total return of 157.4%, which is just a few percentage points lower than that of SDYL. MLPL MLPL is a 2x fund of midstream MLP companies. Since inception in Jul. 2010, the 1x fund MLPI has returned 61.0%. The 2x MLPL has returned 141.9%, while the hypothetical MLPL-D returned 125.2%. Studying the price history of these three funds is instructive. We can see that the strong bull market in MLPs from inception to Jul. 2014 provided roaring returns for both MLPL and MLPL-D. While the 1x MLPI increased by ca. 100% over this time period, and MLPL and MLPL-D returned over 300%, a quadrupling of value. This further reinforces the notion that leverage works in your favor when an asset is in a rising trend (of course, the opposite is just as true). Moreover, MLPL and MLPL-D tracked each other closely during the MLP bull market, the first four years of this chart. Then why did MLPD-D return some 15% less than MLPL since inception? The answer lies in the fifth and final year of this chart, a period of extremely volatility in oil and oil-related stocks. During this period, we see divergence between the two 2x funds, with the monthly-resetting MLPL falling less than the daily-resetting MLPL-D during this time. This seems to support the conventional wisdom that monthly-resetting is superior to daily-resetting during bouts of heightened volatility. BDCL BDCL is a 2x fund of BDCs. BDCL’s inception took place at an unfortunate time, in the midst of the Eurozone debt crisis. BDCL dropped over 40% from its inception in May 2011 before rebounding. Since inception, the 1x BDCS returned 24.6% and the 2x BDCL returned 45.1%, which is slightly less than twice that of the 1x fund. This illustrates the negative effect that leverage has when the underlying asset moves strongly in one direction, and then reverses. To further highlight this, consider the fact that when BDCS (blue line in chart) breaks even in early 2012, BDCL is still approximately 10% below its inception price. While BDCL fared less well than expected, the daily-resetting BDCL-D did even worse. It returned only 31.3% since inception, significantly underperforming BDCL at 45.1%. This further reinforces the notion that monthly-resetting is advantageous when the underlying asset is volatile. MORL MORL owns a 2x leveraged basket of mREITs. Since inception in Oct. 2012, the 1x MORT has returned 13.0% while the 2x MORL has returned 16.7%, which is far lower than twice of the 1x fund. This indicates that like BDCL, MORL has performed worse than expected. As can be seen from the above chart, this can be attributed to the large price swings experienced by the underlying asset, causing leverage to work against the 2x funds. Very surprisingly, however, the hypothetical daily-reset MORL-D (20.10%) actually outperformed MORL. This contradicts the earlier notion that daily resetting is inferior to monthly resetting during volatile periods. The reason for this result is currently unclear to me. CEFL The final fund to be analyzed is CEFL, a fund-of-CEFs. Since inception in Dec. 2013, the 1x YYY has returned -4.5% while the 2x CEFL has returned approximately twice that, at -9.1%. Interestingly, and unlike MORL, the price swings in CEFL did not appear to adversely affect its total return performance. However, this could also be due to CEFL’s shorter history compared to MORL. The hypothetical daily-reset CEFL-D performed only slightly worse than CEFL, at -9.9%. However, this difference is too small for any meaningful conclusions to be drawn for this fund. Conclusion In his article , Dane Van Domelen wrote: In theory, it’s hard to say whether a 2x daily or 2x monthly leveraged ETF should perform better. During steady index growth or decline, daily is better; during volatile periods for the index with little or no net change, monthly is better. The results of this study partially agree with Dane’s conclusion, but also suggest that the real situation, empirically at least, may be a bit more complicated. Analysis of these five 2x monthly-reset ETNs and their hypothetical daily-reset counterparts revealed that: There was no significant difference in performance between monthly and daily resets when the asset was in a steady upward trend, as was the case for SDYL and the first four years of MLPL. MLPL outperformed the daily-reset MLPL-D during the most recent 1-year period, in which the asset tumbled and with high volatility. For the more volatile ETNs, namely BDCL, MORL, and CEFL, the results were mixed. BDCL significantly outperformed BDCL-D over four years, while MORL underperformed MORL-D over three years. CEFL and CEFL-D had comparable results over two years. Overall, four out of five of the monthly-reset ETNs outperformed their daily-reset counterparts, although the differences were often small: SDYL (161.0% vs. 157.4% for SDYL-D), MLPL (141.9% vs. 125.2%), BDCL (45.1% vs. 31.3%) and CEFL (-9.1% vs. -9.9%). The only underperforming monthly-reset ETN was MORL (16.7% vs. 20.1%). The average differential for the 5 ETNs was +6.3%. In summary, with regards to the question posed in the title, “Has Monthly Resetting Helped Or Hurt The ETRACS 2x Leveraged ETNs?”, I would have to say that the jury is still out. I am slightly leaning towards the “helped” side however. This article used mainly empirical and reconstructed data, so I am also interested to hear if any of the more mathematically-inclined investors would be able to provide a more theoretical framework for the monthly vs. daily resetting issue. Disclosure: I/we have no positions in any stocks mentioned, and no plans to initiate any positions within the next 72 hours. (More…) I wrote this article myself, and it expresses my own opinions. I am not receiving compensation for it (other than from Seeking Alpha). I have no business relationship with any company whose stock is mentioned in this article.

An Update On UBS’s ETRACS 2X Leveraged ETNs

Summary Since my last article, UBS has launched two more 2X Leveraged ETRACS ETNs. The mid-year spike in interest rates has pulled down many of these income-generating funds to more attractive levels. Relevant data for all of the funds are updated. Introduction In a Mar. 2015 article entitled ” A Quick Overview Of UBS ETRACS 2X Leveraged ETNs “, I gave a brief introduction to the line-up of 2X leveraged ETNs offered by UBS (NYSE: UBS ). These ETNs cover a broad range of investment classes, including traditional equity as well as alternative investment types such as real estate investment trusts [REITs], mortgage REITs [mREITs], master limited partnerships [MLPs], business development companies [BDCs] and closed-end funds [CEFs]. The use of 2X leverage allows these ETNs to offering alluring headline yields. For further general information regarding the pros and cons of leverage, as well as specific risks regarding these ETNs, please see my previous article . New offerings In May 2015, UBS launched the ETRACS Monthly Pay 2xLeveraged MSCI US REIT Index ETN (NYSEARCA: LRET ), an ETN that tracks twice the monthly return of the MSCI US REIT Index (the same index tracked by the giant Vanguard REIT ETF (NYSEARCA: VNQ )). LRET charges 1.96% in total fees (see below for how this is calculated), and sports a headline 2X index yield of 7.45%. In July 2015, UBS launched ETRACS 2xMonthly Leveraged S&P MLP Index ETN (NYSEARCA: MLPV ), which tracks twice the monthly return of the S&P MLP index. MLPV charges 2.26 in total fees, and sports a headline 2X index yield of 12.49%. The funds UBS currently offers fifteen 2X leveraged ETNs. The following table shows the fund name, ticker symbol, 12-month trailing yield, inception date, the corresponding 1X leveraged fund (where available), average trading volume and total expense ratio [TER] of the ETNs. The TERs were obtained from the funds’ pricing supplements and the remaining data are from Morningstar . Where 12-month trailing yields are not available (for more recent launches), the 2X index yield provided by UBS has been presented. UBS engages in the (rather dubious, in my opinion) practice of hiding their financing spread within their pricing supplement, which makes their headline management fee (known as “tracking rate”) look lower. For example, the UBS ETRACS Monthly Pay 2x Leveraged S&P Dividend ETN (NYSEARCA: SDYL ) has an annual tracking rate of 0.30%, a figure that is displayed prominently on the fund’s website, but you have to dig into the pricing supplement to see that you are being charged an additional 0.40% financing spread, which means that the total financing rate will be 0.40% + 3-month LIBOR (currently 0.31%). Adding all three fees together gives a total expense ratio of 0.30% (tracking rate) + 0.40% (financing spread) + 0.31% (3-month LIBOR) = 1.01%. Since LIBOR is subject to change, in my previous article I excluded LIBOR when quoting the TER of the funds (while reminding readers to be aware of this expense). However, in this article I have decided to quote TER to be inclusive of LIBOR (currently 0.31%) to give investors a better idea of the total fees that are currently paying. Additionally, note that because the funds are 2X leveraged, one should divide the TER by two if one wish to compare the expense ratios with unleveraged funds. I have also rearranged the categories of the funds somewhat compared to the last article. All broad equity, dividend equity, small-cap equity and homebuilder equity ETNs are grouped under “Equity”. The “Alternative Equity” class includes MLP, REIT, mREIT, and BDC funds. “Balanced” includes CEF and multi-asset funds. Fund Ticker Yield Inception Volume TER* 1X Alternative Equity             Monthly Reset 2xLeveraged S&P 500 Total Return ETN (NYSEARCA: SPLX ) N/A(1) 3/2014 9K 1.56% SPDR S&P 500 Trust ETF (NYSEARCA: SPY ) Monthly Pay 2xLeveraged S&P Dividend ETN SDYL 5.43% 5/2012 1.8K 1.01% SPDR Dividend ETF (NYSEARCA: SDY ) Monthly Pay 2xLeveraged Dow Jones Select Dividend Index ETN (NYSEARCA: DVYL ) 8.09% 5/2012 8K 1.06% iShares Select Dividend ETF (NYSEARCA: DVY ) Monthly Pay 2xLeveraged US High Dividend Low Volatility ETN (NYSEARCA: HDLV ) 10.02%^ 9/2014 15K 1.76%   Monthly Pay 2xLeveraged US Small Cap High Dividend ETN (NYSEARCA: SMHD ) 17.70%^ 3/2015 23K 1.96%   Monthly Reset 2xLeveraged ISE Exclusively Homebuilders ETN (NYSEARCA: HOML ) N/A(1) 3/2015 23K 1.96% ISE Exclusively Homebuilders ETN (NYSEARCA: HOMX ) Alternative Equity             Monthly Pay 2xLeveraged Wells Fargo MLP Ex-Energy ETN (NYSEARCA: LMLP ) 13.56% 6/2014 23K 1.76% Wells Fargo MLP Ex-Energy ETN (NYSEARCA: FMLP ) Monthly Pay 2xLeveraged MSCI US REIT Index ETN LRET 7.45%^ 5/2015 63K 1.96% Vanguard REIT ETF [VNQ] Monthly Pay 2xLeveraged Mortgage REIT ETN (NYSEARCA: MORL ) 26.52% 10/2012 289K 1.11% Market Vectors Mortgage REIT Income ETF (NYSEARCA: MORT ) Monthly Pay 2xLeveraged Dow Jones International Real Estate ETN (NYSEARCA: RWXL ) 4.99% 3/2012 24K 1.31% SPDR Dow Jones International Real Estate ETF (NYSEARCA: RWX ) 2xMonthly Leveraged Long Alerian MLP Infrastructure Index ETN (NYSEARCA: MLPL ) 15.02% 7/2010 103K 1.16% Alerian MLP Infrastructure Index ETN (NYSEARCA: MLPI ) & ALPS Alerian MLP ETF (NYSEARCA: AMLP ) 2xMonthly Leveraged S&P MLP Index ETN MLPV 12.49%^ 7/2015 1.6K 2.26% iPath S&P MLP ETN (NYSEARCA: IMLP ) 2xLeveraged Long Wells Fargo Business Development Company Index ETN (NYSEARCA: BDCL ) 20.24% 5/2011 164K 1.16% Wells Fargo Business Development Company ETN (NYSEARCA: BDCS ) Balanced             Monthly Pay 2xLeveraged Closed-End Fund ETN (NYSEARCA: CEFL ) 22.04% 12/2013 150K 1.21% YieldShares High Income ETF (NYSEARCA: YYY ) Monthly Pay 2xLeveraged Diversified High Income ETN (NYSEARCA: DVHL ) 16.56% 11/2013 15K 1.56% Diversified High Income ETN (NYSEARCA: DVHI ) * Includes 3-month LIBOR (currently 0.31%). ^ 2X index yield provided by fund sponsor. Actual yield may be different. (1) No dividends are paid out as this is a total return fund. Recent performance A chart of the total return performance of the 6 equity-based 2X leveraged ETNs (excluding SMHD, which for some reason doesn’t show on YCharts) since my last article is presented below. SPLX Total Return Price data by YCharts The graph above shows that the 2X homebuilder ETN HOML has outperformed with a total return of 9.88% since Mar. 2010, followed by SPLX with 3.78%. HDLV had a slight positive return of 2.76%, while the two “vanilla” dividend ETNs, SDYL and DVYL, had the lowest total returns of -1.05% and -2.57%, respectively. However, if SMHD had been included in this graph, it would have been by far the worst-performing fund, with a total loss exceeding -15%. A chart of the total return performance of the 7 alternative equity-based 2X leveraged ETNs (excluding LRET and MLPV whose histories are too short) since my last article is presented below. LMLP Total Return Price data by YCharts Unfortunately, all five of the alternative equity ETNs shown in the chart have had negative returns since Mar. 2015. This is not surprising because many of these asset types are considered to be income-generating vehicles that suffered significantly during the interest rate spike in the first half of 2015. MLPL had the worst total return of -21.7%, a consequence of collapsing oil prices, while MORL had the second-lowest total return of -12.8%. The best (relative) performance was turned in by the 2X international real estate ETN RWXL, at -7.17%, followed by BDCL at -7.87%. LMLP had a total return of -8.06% over this period. Finally, a chart of the total return performance of the 2 balanced 2X leveraged ETNs since my last article is presented below. CEFL Total Return Price data by YCharts We can see from the chart above that CEFL had a total return of -9.68% while DVHL had a total return of -12.0%. The total return performances of the 2X leveraged ETNs since Mar. 2015 is shown in the chart below, arranged in order of highest to lowest return. Equity funds are in green, alternative equity funds are in blue, and balanced funds are in yellow. We can see from the chart above that the equity ETNs have had the best total return performances since Mar. 2015. In fact, the five best-performing funds were all equity ETNs. The notable exception of this class was SMHD, which performed poorly. Distributions Most of the funds have “Monthly Pay” in their title, and therefore these funds pay monthly. BDCL, MLPL and MLPV pay quarterly, while SPLX and HOML are total return funds and so they pay out nothing at all. However, investors should be aware that the monthly payments can be quite lumpy. This is especially true when the majority of the underlying constituents of the fund pay quarterly dividends on the same month. An extreme example is MORL, where the “big month” distributions are approximately 10 times as large as the two “small month” distributions. The yields of the funds are also displayed graphically below, arranged in order of smallest to highest yield. Equity funds are in green, alternative equity funds are in blue, and balanced funds are in yellow. We can see from the graph above that MORL has the highest yield, at 26.52%, while CEFL and BDCL have the second and third-highest yields of 22.04% and 20.24%, respectively. At the other end of the spectrum, RXWL, SDYL and LRET have the lowest yields of 4.99%, 5.43% and 7.45%, respectively. Expense ratios As explained above, the headline expense ratio (or “tracking rate”) stated on the UBS website for the ETRACS products is not the total fee charged by the ETNs. One must delve into the pricing supplement to ascertain the additional “financing spread” charged by the issuer. The sum of the two expense ratios is then added to the 3-month LIBOR (currently 0.31%) to calculate the TER of the funds. Additionally, and as mentioned above, the TER should be divided by two if one wishes to compare the expense ratios of these ETNs to non-leveraged funds. The TERs ( including 3-month LIBOR, currently 0.31%) of the funds is also depicted graphically below, from lowest to highest. The breakdown of the TERs are also shown. In my previous article, I wrote that: Finally, we observe that the TERs of the funds span a wide range of values, from 0.80% to 1.65%, with the somewhat unsettling observation that the more recent funds have been launched with higher expense ratios. That statement turned out to be somewhat prophetic as the two funds launched since my last article, LRET and MLPV, have the highest TERs of 1.96% and 2.26%, respectively (HOML and SMHD, two other recent launches, are tied for second at 1.96%). For LRET, the financing spread is shown in the “pricing supplement”, which can be accessed from the fund website : (click to enlarge) For the newest launch, MLPV, there is no pricing supplement. This was the case for two of UBS’ earliest funds, BDCL and MLPL, who do not possess the veiled financing spread. I was ecstatic. I thought “maybe UBS was reading my articles that shed light on their shenanigans and finally decided to lower their expense ratios for the benefit of their investors.” Alas, I was wrong. Instead of a pricing supplement, the financing spread was detailed, for the first time, in the prospectus supplement, which can be accessed from the fund website . The cynic in me thinks that the reason that UBS moved the financing spread from their pricing supplement to their prospectus supplement is to further obfuscate investors about the presence of said spread. After all, why would someone invest in their new launch MLPV, which charges 2.26% in expense ratio, when they could invest in the similar 2X leveraged MLP ETN MLPL, which charges only 1.16% in fees? However, the unwitting investor would not know about this difference because the headline tracking rate displayed for MLPV (0.95%) is only 0.10% higher than that for MLPL (0.85%). I therefore call on UBS to display all relevant expenses clearly on their fund website instead of in fine print within the pricing or product supplements. Conclusion The 2X leveraged funds allow investors to obtain leveraged participation in traditional equity as well as alternative equity classes such as REITs, mREITs, BDCs, MLPs and CEFs. For the average investor, this leverage can be obtained much more cheaply compared to a margin loan from a broker. For example, for the smallest account size, Charles Schwab (NYSE: SCHW ) charges 8.50%, Fidelity 8.575%, Scottrade 7.75%, Merrill Edge 8.625%. Only Interactive Brokers (NASDAQ: IBKR ) (which I use) offers a competitive margin rate at 1.61% for their smallest accounts. This article also provides an update on the two newest issues, LRET and MLPV. Regrettably, the expense ratios of these two funds are the highest or tied-highest of all the ETNs launched so far. While several of these leveraged ETNs offer sky-high yields, investors need to be aware of the drawbacks of these funds, which include leverage decay (which is somewhat ameliorated by the monthly reset), significant expense ratios and credit risk of the fund sponsor [UBS]. Of course, these risks are on top of the inherent risks of investing in each asset class. For example, MLPs are sensitive to commodity prices while REITs/mREITs are sensitive to interest rates. Interested readers may also consult my recent articles on HDLV and CEFL . Disclosure: I am/we are long CEFL, BDCL, MLPL, MORL, LMLP. (More…) I wrote this article myself, and it expresses my own opinions. I am not receiving compensation for it (other than from Seeking Alpha). I have no business relationship with any company whose stock is mentioned in this article.

10%-Yielding HDLV May Be A Good Choice If Interest Rates Remain Low

Summary HDLV is filled with blue-chip cash-generating machines. The recent mini-“Taper tantrum” sparked a sell-off in dividend stocks. HDLV is up only 12% from its 52-week lows and may be a good choice if interest rates don’t rise. Introduction In December of 2014, I comprehensively analyzed the methodology and composition of the ETRACS Monthly Pay 2xLeveraged US High Dividend Low Volatility ETN (NYSEARCA: HDLV ), a fund that was only incepted a few months prior. HDLV is a 2x leveraged fund that seeks to hold U.S. companies that possess both a high yield and low volatility. Readers may refer to my previous article for more detailed information on the methodology and composition of this fund. The recent mini-“Taper tantrum” has sparked a sell-off in dividends stocks, particularly those deemed to bond-like. Not surprisingly, this includes many of the top constituents in HDLV, which include blue-chip cash-generating machines such as Verizon Communications (NYSE: VZ ), AT&T (NYSE: T ), Philip Morris (NYSE: PM ), Altria Group (NYSE: MO ) and Duke Energy (NYSE: DUK ). As HDLV is nearly one-year old, this article seeks to provide an update on HDLV to see if it has been able to meet its dual mandate of high dividends and low volatility. Recent performance The graph below shows the price of HDLV and the yield of the 10-year treasury note since February of this year. We can see from the chart that the two lines move in opposite directions, suggesting that the recent price action of HDLV (or rather, its underlying constituents) has been driven by investor fixation on interest rates rather than any material change in the fundamentals of the companies. Interest rates have fallen again over the last two months, allowing HDLV to rise around 12% from its 52-week lows. HDLV data by YCharts How has HDLV performed relative to the broader market? HDLV is a 2X leveraged ETN that tracks twice the monthly performance of the underlying index, which has been considered to be a strategy that reduces the “beta decay” of leveraged securities. Therefore, the performance of HDLV since inception is compared to the UBS ETRACS Monthly Reset 2xLeveraged S&P 500 total Return ETN (NYSEARCA: SPLX ), and the Direxion Monthly NASDAQ-100 Bull 2X Fund (MUTF: DXQLX ), which track twice the monthly return of S&P 500 and NASDAQ-100, respectively. The chart above shows that DXQLX has had by far the best total performance. Although HDLV has recently underperformed, its total return since inception is still slightly higher than that of SPLX. Volatility Has HDLV managed to exhibit lower volatility than the broader market? Unfortunately, as SPLX is not very liquid, its volatility data is distorted by the high bid-ask spreads on the instrument. Therefore, I used the ProShares Ultra S&P 500, a daily-resetting 2X leveraged version of the SPDR S&P 500 Trust ETF ( SPY), instead. The graph below shows the 30-day rolling volatility of HDLV and the ProShares Ultra S&P 500 ETF (NYSEARCA: SSO ) since Nov. 2014. HDLV 30-Day Rolling Volatility data by YCharts The graph above shows that for slightly over half the time, HDLV has had a lower volatility than SSO, suggesting that is has been less volatile than the broader market. This data is corroborated by InvestSpy , which shows HDLV having significantly lower volatility and beta compared to SSO since inception. One area where HDLV appears to underperform SSO is in its maximum drawdown of -14.50% compared to -10.40% for SSO. However, the maximum drawdown figures may not be directly comparable because HDLV resets its leverage monthly whereas SSO resets daily. Ticker Annualized Volatility Beta Daily VaR (99%) Max Drawdown Total return HDLV 21.70% 1.13 3.20% -14.50% 14.60% SSO 25.20% 2 3.70% -10.40% 15.80% SPY 12.60% 1 1.90% -5.30% 9.00% Composition Since my last article in December of 2014, HDLV has undergone three rebalancing events (in January, April and July). The table below shows the top 10 constituents of HDLV in Dec. 2014 and Aug. 2015. Dec. 2014 Aug. 2015 Name Ticker Weighting / % Name Ticker Weighting ConocoPhillips (NYSE: COP ) 10.11 Verizon Communications Inc. VZ 9.89 Verizon Communications Inc. VZ 10.01 AT&T Inc. T 9.55 AT&T Inc. T 9.77 Philip Morris International PM 9.42 Philip Morris International PM 9.20 Altria Group Inc. MO 8.87 Altria Group Inc. MO 7.62 Duke Energy Corp DUK 6.89 Duke Energy Corp DUK 5.84 Southern Co SO 6.18 Southern Co (NYSE: SO ) 5.04 Ventas Inc (NYSE: VTR ) 4.06 Health Care Reit Inc (NYSE: HCN ) 3.90 Health Care Reit Inc HCN 3.70 PPL Corp (NYSE: PPL ) 3.34 Consolidated Edison Inc (NYSE: ED ) 3.68 Entergy Corp. (NYSE: ETR ) 3.11 HCP Inc (NYSE: HCP ) 3.29 Top 10 total 67.94 65.53 We can see that 7 companies, namely VZ, T, PM, MO, DUK, SO and ECN, have remained in the top 10 of constituents of HDLV since 8 months ago. 3 companies have been removed from the top 10 of constituents, including the former top holding COP, as well as PPL and ETR. Meanwhile, VTR, ED and HCP have joined the top 1o constituents of HDLV. Moreover, and as mentioned in my previous article, HDLV is a very top-heavy fund. The top 10 constituents currently account for 65.53% of the total assets of the fund, down slightly from 67.94% in Dec. 2014. As a counterpoint, given that the names in the top 10 are all blue-chip, cash-generating, “widow-and-orphan” stocks, this underdiversification of companies does not unduly worry me. However, what maybe a cause for concern is the underdiversification of sectors . The top 10, or 65.53% of the fund, is entirely concentrated into telecommunications (T, VZ), tobacco companies (PM, MO), utilities (DUK, SO, ED) and healthcare REITs (VTR, HCN and HCP). These sectors are quite interest-rate sensitive, and thus may all decline together when (if?) rates rise, or conversely move up together when rates fall, as has been the case for the past year. Dividends HDLV has paid out 10 dividends since inception, as shown in the chart below. These distributions sum up to $2.12, which based on the current price of $26.64 and annualized to 12 months represents a yield of 9.57% . Risks HDLV charges a management expense ratio of 1.45%, which constituents of a tracking error of 0.85% and a surreptitiously hidden financing spread of 0.60%. This is added to the three-month LIBOR of 0.31% to give a total expense ratio of 1.76%. While this seems high, keep in mind that owning HDLV allows you to effectively control 2X of assets. Therefore, dividing the total expense ratio of 1.76% by 2 gives an effective expense ratio per dollar of assets controlled of 0.88%. If we don’t include the LIBOR in the expense ratio, the effective expense ratio (-LIBOR) is 0.73%. While this is still higher than other popular dividend ETFs such as the iShares Select Dividend ETF (NYSEARCA: DVY ) (0.39%), the SPDR S&P Dividend ETF (NYSEARCA: SDY ) (0.35%) and the Vanguard Dividend Appreciation ETF (NYSEARCA: VIG ) (0.10%), the ability to access cheap leverage may still make this fund more cost-effective for investors than buying on margin themselves. Additionally, and as mentioned above, the constituents of HDLV are quite interest-rate sensitive, and so this fund will likely decline if interest rates spike higher. Finally, as HDLV is an ETN, it is subject to the credit risk of the issuer, in this case UBS. Conclusion I believe that HDLV has been able to meet its dual mandate of high and dividends and low volatility over the past 12 months. Investors who believe that low interest rates are here to stay for longer will be attracted to the blue-chip, income-generating nature of the top constituents of HDLV. The 2X leveraged nature of HDLV has pushed its trailing yield to 9.57% (annualized from 10 months). Moreover, HDLV is currently up only around 12% from its 52-week lows, which may be an attractive entry point for initiating a position. On the other hand, drawbacks of this fund are its overconcentration in companies and sectors, and its sensitivity to interest rates. Readers interested in other high-dividend low-volatility funds may peruse my previous articles on the PowerShares S&P 500 High Dividend Portfolio ETF (NYSEARCA: SPHD ) and the Global X SuperDividend U.S. ETF (NYSEARCA: DIV ). Disclosure: I/we have no positions in any stocks mentioned, but may initiate a long position in HDLV over the next 72 hours. (More…) I wrote this article myself, and it expresses my own opinions. I am not receiving compensation for it (other than from Seeking Alpha). I have no business relationship with any company whose stock is mentioned in this article.