An Overview Of A Timber And Forestry Play – WOOD
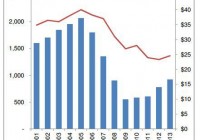
Summary Prices for timber and timber stocks are generally correlated with new housing starts. Timber and forestry stocks offer exposure to a renewable resource industry. Upticks in housing starts have not resulted in equal magnitudes of timber price gains, which suggests that price increases are forthcoming. While there are many plays for investors who wish to profit from a recovering housing market, one often overlooked alternative is timber and forestry related stocks. As I’ve said in various articles, I’m generally a fan of owning ETFs over individual holdings for their low fees and diversification, and this is no exception. One such ETF alternative is the iShares Global Timber & Forestry ETF (NASDAQ: WOOD ). This ETF offers exposure to Companies that produce forest, agricultural, paper and packaging products. According to Blackrock (NYSE: BLK ), the fund seeks to track: The investment results of an index composed of global equities in or related to the timber and forestry industry. What drives demand for timber and forestry products and services? The level of new residential construction activity. Demand for repair and remodeling. Demand for wood chips for use in paper and wood products. The U.S. Department of Housing and Urban Development released New Residential Construction statistics wednesday that were less than stellar, but nonetheless point to a moderate recovery. Key takeaways January 2015 building permits fell .7% from the revised December 2014 seasonally adjusted rate of 1,060,000, but were up 8.1% from January 2014. January 2015 privately owned housing starts were down 2% from December but up 18.7% from January 2014. January 2015 single family housing completions were 1.3% above December 2014 estimates and 9.4% above January 2014 estimates. Housing markets are regarded as somewhat choppy, with interest rates continuing to hover near historic lows at an average of 3.69% on 30 year mortgages (up from 3.59%), while stagnant wages continue to weigh on potential home buyers. Nonetheless, last month, the Mortgage Bankers Association reported that the seasonally adjusted index of mortgage applications posted the largest gain (49.1%) since the middle of the Great Recession. Homebuilder confidence fell from 57 to 55 , according to the National Association of Homebuilders release on Tuesday, but results above 50 still indicate that more homebuilders view market conditions favorably as opposed to negatively. Why invest in timber and forestry stocks? Timber and forestry stocks offer an opportunity to invest in a renewable resource. Housing starts drive timber prices. Housing starts have rebounded since 2009 lows, but sawtimber stumpage prices have not responded as quickly. (Source Rayonier Investor Presentation) Housing starts are projected to increase over the near-term, which should result in an uptick in both demand for and prices of sawtimber. (Source Rayonier Investor Presentation) ETF Overview (data as of 2/18/15 courtesy of Blackrock unless otherwise stated) Price (as of 2/18/15) $56.11 NAV Total Return YTD 5.83% Net assets $323,169,989 Inception date June 2008 Benchmark index – S&P Global Timber & Forestry Index Geographic and Industry Exposure (courtesy of Blackrock) Notes – Despite being a “global fund”, over 64% of the Company’s geographic concentration is in North America. Notes – This “sector” breakdown is a tad misleading, because as shown below, the REITs are generally focused within the Paper & Forest products industry. REITs do however, have different tax and ownership characteristics than other publicly traded securities. Top 5 Holdings as of 2/19/15 West Fraser Timber Co ( OTCPK:WFTBF ) 8.36% West Fraser Timber is an integrated wood products company that produces wood chips, lumber, LVL, MDF, plywood, pulp and newsprint. The Company operates in western Canada and the southern U.S. and trades on the Toronto Stock exchange. Weyerhaeuser REIT (NYSE: WY ) 7.99% Weyerhaeuser operates in four general segments, timberlands, wood products, cellulose fibers and real estate. According to Weyerhaeuser’s most recent annual report , the Company grows and harvests trees, manufactures and sells products made from trees, builds and sells homes and develops land. The Company’s largest market is the United States, however it has a significant customer base in Japan, Europe, China and Canada. Plum Creek Timber Company REIT (NYSE: PCL ) 7.83% Plum Creek owns approximately 6.8 million acres of timberlands across 19 states. The Company operates in the following segments, Northern Resources (timberlands in Maine, Michigan, Montana, New Hampshire, Oregon, Vermont, Washington, West Virginia, and Wisconsin); Southern Resources (timberlands in Alabama, Arkansas, Florida, Georgia, Mississippi, Louisiana, Mississippi, North Carolina, South Carolina, Texas and Virginia); Energy and Natural Resources (oil and natural gas production, construction aggregates, mineral extraction, wind power and communication rights of way); Real Estate (sales of higher and better use timberlands); and Manufacturing (lumber mills, plywood mills, medium density fiberboard and lumber remanufacturing). Rayonier REIT (NYSE: RYN ) 6.26% Rayonier owns, leases or manages 2.6 million acres of timberlands in nine states and New Zealand. The Company is the third-largest timber REIT and operates in two reportable segments: Forest Resources (harvesting of timber and other valued added activities such as leasing for hunting/mineral extraction and cell towers) and Real Estate (property sales including higher and better use). MeadWestvaco Corp (NYSE: MWV ) 4.71% MeadWestvaco is a global company that provides packaging products for the healthcare, personal care, food, beverage, tobacco and agricultural industries. The Company also produces specialty chemicals for the automotive energy and infrastructure industries. A word of caution Spectacular collapses in the housing market can result in equally spectacular collapses in timber prices and timber and forestry related stocks. If you are unsure of the general direction and momentum of the U.S. housing market, consider other natural resource alternatives. The ETF is thinly traded (average volume of less than 25,000). This can result in unfavorable bid-ask spreads. The market pricing mechanism of thinly traded ETFs is not always efficient. As recent as 2012, WOOD traded at a premium as high 1.07% to its NAV and at a discount as low as 1.16%. That spread of over 200 basis points could make the difference between a profitable trade and a loss depending on the timing of entry and exit. Disclosure: The author has no positions in any stocks mentioned, and no plans to initiate any positions within the next 72 hours. (More…) The author wrote this article themselves, and it expresses their own opinions. The author is not receiving compensation for it (other than from Seeking Alpha). The author has no business relationship with any company whose stock is mentioned in this article.


