Tag Archives: bstresource

Risks And Avoidable Mistakes For 2015

Originally published on Jan. 4, 2015 Introduction For most dollar oriented investors 2014 was an “okay” year with a third year in a row of double digit gains for the S&P 500, but not for the bulk of institutional accounts. Consciously or not, many investors and managers were aware of the length of the present bull market having entered its 61st month. This has created twin dilemmas for the prudent management of responsible money. First dilemma – Large Cap over-ownership As regular readers of these posts recognize and true to my analytical history, I tend to view investments through the lens of mutual funds. When simplifying the fund performance data for 2014 by size of market capitalizations the following is revealed: Large Cap funds 11% Multi-cap funds (Unrestricted/ or “go anywhere” funds 9% Mid Cap funds 8% Small Cap funds 3% In a dynamic economy the rank order of operating earnings power generation would be in the opposite order, being led by Small Caps or possibly the successful “Go Anywhere” funds. Focusing on operational earnings, excluding foreign exchange benefits, I believe that the Large Caps were producing approximately 3 times the long-term growth of the Small Caps. The better market performance of the Large Caps, I believe, was a function of market structure changes. Some institutional investors being concerned with the duration of this bull market moved heavily into Large Cap stocks directly or more importantly through the use of ETFs invested in the S&P 500 and other indices. Because of perceived greater liquidity in Large Caps they were hiding out in what we used to call warehouses. With governments all over the world looking to Large Caps being “social progress” engines, I have some doubts as to the growth prospects for Large Cap companies. Second dilemma – Historical constraints As is often the case, apparent boundaries come with both hard data and locked-in thought processes. The data is the easy part. While as noted we are in the sixty-first month of the recovery, of the nine last market recoveries, four have been over 100 days in length with the longest being 181 days. Thus for a manager a possible career risk is exiting too soon which puts a premium on investing in liquid positions. Because so many others have made similar judgments as to the better liquidity in Large Caps, if there is a sudden drop in the market, I believe the excessive amount invested in Large Caps will find their exit liquidity either expensive or non-existent for those that are late. The biggest risk for investors and their managers are the biases that many of us labor with in making so-called rational decisions. The following are a list of these biases as listed by Essential Analytics. List of biases Outcome, herding, conviction (the curse of knowledge), recency, framing, band wagon effect, information, anchoring, optimism. I suggest that many of these biases find their way into reports; supporting in effect, the reasons we all have made decisions that haven’t worked out. The key for all of us is to understand our biases. Some biases we will be able to overcome. Others we will have to accept as immutable. This suggests that when putting together a portfolio of funds or managers, it would be wise to try to diversify the various biases of the hired portfolio managers as well as our own as the owners or fiduciaries of the capital being deployed. Overcoming biases I have a definite advantage in this task by personality. By nature I am both curious of what I don’t know and often a contrarian. As a contrarian again using the mutual fund microscope, the following may be useful thoughts: Looking to extremes one might wish to set up a pair trade of being long some of the components in the S&P Latin American energy index which declined -39% vs. the average Indian fund which was up 41% in 2014. In a similar fashion one might start to research funds in the following groups that declined in 2014: Energy Commodity funds -34% General Commodity funds -16% Global Natural Resources funds -15% Domestic Natural Resources funds -15% Dedicated Short-bias funds -15% I take some comfort in the contrarian thoughts contained in the headline to John Authers insightful Financial Times column: “The case for gently shifting money away from US.” I believe a well-reasoned portfolio should be looking for opportunities on a global basis both in terms of what companies do and where various securities are traded. Final thought Many year-end predictions are essentially extrapolations of existing market trends and this could be what will happen. However, I am searching for the beginnings of new trends that will produce +20% or -20% in a twelve month period. I would appreciate hearing your thoughts as to when and which direction (or both) you expect price movement. I firmly believe we will once again experience this kind of action.
FNDF Has Great Risk Factors And Enough Liquidity, But I Really Dislike The Cash Position

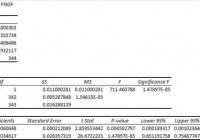
Summary I’m taking a look at FNDF as a candidate for inclusion in my ETF portfolio. The extremely low correlation with other major funds (like SPY) is great and holds up despite a decent time frame and high volume of trades. The expense ratio is a bit high for my liking and is combined with a fairly large position in cash. Investors should treat cash in an ETF as a savings account that charges them an expense ratio instead of paying interest. I’m not assessing any tax impacts. Investors should check their own situation for tax exposure. Investors should be seeking to improve their risk adjusted returns. I’m a big fan of using ETFs to achieve the risk adjusted returns relative to the portfolios that a normal investor can generate for themselves after trading costs. I’m working on building a new portfolio and I’m going to be analyzing several of the ETFs that I am considering for my personal portfolio. One of the funds that I’m considering is the Schwab Fundamental International Large Company Index ETF (NYSEARCA: FNDF ). I’ll be performing a substantial portion of my analysis along the lines of modern portfolio theory, so my goal is to find ways to minimize costs while achieving diversification to reduce my risk level. What does FNDF do? FNDF attempts to track the total return of the Russell Fundamental Developed ex-U.S. Large Company Index. Normally at least 90% of the assets are invested in funds included in this index, but there appears to be some leeway under unusual market conditions. FNDF falls under the category of “Foreign Large Value.” Does FNDF provide diversification benefits to a portfolio? Each investor may hold a different portfolio, but I use the SPDR S&P 500 Trust ETF (NYSEARCA: SPY ) as the basis for my analysis. I believe SPY, or another large cap U.S. fund with similar properties, represents the reasonable first step for many investors designing an ETF portfolio. Therefore, I start my diversification analysis by seeing how it works with SPY. I start with an ANOVA table: (click to enlarge) The correlation is only 82%, which is very solid for modern portfolio theory. Extremely low levels of correlation are wonderful for establishing a more stable portfolio. I consider anything under 50% to be extremely low. However, when I see those values it usually comes with issues, such as low average volume, which can create distorted statistics. For an ETF with around 184,000 shares trading hand each day, the 82% is very impressive. Standard deviation of daily returns (dividend adjusted, measured since August 2013) The standard deviation is pretty good. For FNDF it is 0.8055%. For SPY, it is 0.6891% for the same period. SPY usually beats other ETFs in this regard. If an ETF is only 0.10% to 0.15% over SPY with heavy trading volume it is doing fairly well for stability. Mixing it with SPY I also run comparisons on the standard deviation of daily returns for the portfolio assuming that the portfolio is combined with the S&P 500. For research, I assume daily rebalancing because it dramatically simplifies the math. With a 50/50 weighting in a portfolio holding only SPY and FNDF, the standard deviation of daily returns across the entire portfolio is 0.7135%. With 80% in SPY and 20% in FNDF, the standard deviation of the portfolio would have been 0.6898%. If an investor wanted to use FNDF as a supplement to their portfolio, the standard deviation across the portfolio with 95% in SPY and 5% in FNDF would have been 0.6881%. Why I use standard deviation of daily returns I don’t believe historical returns have predictive power for future returns, but I do believe historical values for standard deviations of returns relative to other ETFs have some predictive power on future risks and correlations. Yield & Taxes The distribution yield is 0.50%. Retirees seeking yields won’t find them here, but the low correlation still looks good for investors that don’t need strong yields. I’m not a CPA or CFP, so I’m not assessing any tax impacts. Expense Ratio The ETF is posting 0.32% for an expense ratio. I want diversification, I want stability, and I don’t want to pay for them. The expense ratio on this fund is higher than I want to pay for equity securities, but not high enough to make me eliminate it from consideration. Market to NAV The ETF is at a 0.85% premium to NAV currently. Premiums or discounts to NAV can change very quickly so investors should check prior to putting in an order. I don’t want to pay a premium over 0.2%, and this premium has persisted despite a respectable amount of daily volume. I don’t see these premiums as sustainable over the long term, so I would be concerned about entering a position without seeing the premium drop first. Largest Holdings The diversification within the ETF is pretty good, so long as we only look at the equity securities. (click to enlarge) I’m not big on the holdings including a 10% value for U.S. dollars. I have nothing against dollars, but I already have them in my checking and savings account. Neither of those accounts are charging me an expense ratio. Conclusion I’m currently screening a large volume of ETFs for my own portfolio. The portfolio I’m building is through Schwab, so I’m able to trade FNDF with no commissions. I have a strong preference for researching ETFs that are free to trade in my account, so most of my research will be on ETFs that fall under the “ETF OneSource” program. For the level of liquidity, the low correlation is great. However, I’m not comfortable investing at a significant premium to NAV and with the high volumes of trades the bid-ask spread may be tight enough that I wouldn’t have a very good shot of triggering a limit buy order at the price I would want to use. Even if I put those issues aside, I’m not big on buying into an ETF with a pile of cash earning an expense ratio. I have quite enough exposure to cash through my bank accounts without having an ETF hold it for me. Additional disclosure: Information in this article represents the opinion of the analyst. All statements are represented as opinions, rather than facts, and should not be construed as advice to buy or sell a security. Ratings of “outperform” and “underperform” reflect the analyst’s estimation of a divergence between the market value for a security and the price that would be appropriate given the potential for risks and returns relative to other securities. The analyst does not know your particular objectives for returns or constraints upon investing. All investors are encouraged to do their own research before making any investment decision. Information is regularly obtained from Yahoo Finance, Google Finance, and SEC Database. If Yahoo, Google, or the SEC database contained faulty or old information it could be incorporated into my analysis. The analyst holds a diversified portfolio including mutual funds or index funds which may include a small long exposure to the stock.

The U.S. Economy’s Recovery Weighs On SLV

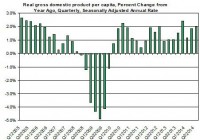
Summary The progress of the U.S. economy is keeping down SLV. The minutes of the last FOMC meeting may shed light on the next FOMC move. The upcoming non-farm payroll could also bring down SLV if it reaches or passes market expectations. The recovery of iShares Silver Trust (NYSEARCA: SLV ) any time soon remains questionable as the U.S. economy keeps showing signs of recovery and the FOMC is slowly setting the groundwork for a rate hike, which could be another blow for silver. Let’s take a closer look at the progress of the U.S. economy, examine what’s next for the FOMC and the relation to SLV. Is the U.S. economy doing better? The U.S. economy has improved in the past few quarters, albeit it has yet to return to its pre crisis levels (before the recent economic meltdown); let’s examine the U.S. GDP per capita. Data taken from FRED Between 2012 and 2014 the average annual growth rate (per quarter) was around 1.6% – back in 2000-2006 the average growth rate was 1.8% and in the second half of the ’90s this figure was 2.8%. Conversely, during 2010-2011 the average rise in GDP per capita was only 1.3%. So the growth rate has picked up, but it still has more room to improve. The progress of the U.S. economy is one factor that influences SLV investors whether or not to hold on to their investment. As the U.S. economy recovers, the demand for silver on paper tends to diminish as it did back in 2013-2014. Another important aspect to consider is the progress in the U.S. labor market, including employment and wages. (click to enlarge) Data taken from FRED Even though the number of non-farm payrolls have picked up, the U.S. hourly wages remained relatively flat in recent quarters. This turn of events could actually also play against SLV. If wages were to remain flat, this could suggest little growth in core inflation. If the U.S. inflation doesn’t rise, this could actually also reduce the demand for precious metals investments, including SLV. The upcoming non-farm payroll report will be released on Friday. (click to enlarge) Data taken from Bureau of Labor Statistics The market’s reaction tends to be negative to the news about the change in number of non-farm payroll. Current estimates put the number of added jobs at 241,000 – lower than in previous months but still inline with the average growth in jobs over the past year. Reaching this figure could set SLV for another tumble by the end of the week. Finally, this week the minutes of the last FOMC meeting will be released. This will come after the last meeting of 2014 revealed a change in wording of the statement. The Federal Reserve monetary policy tends to have a strong relation with the progress of the price of SLV. If the Fed were to turn more hawkish as it did in the past couple of years, this is likely to further reduce the demand for silver for investment purposes. Last time, the FOMC made some changes in the policy including omitting the term “considerable time” as a time frame for the next rate hike. But the wording didn’t seem to go down well as there were three dissenters to the decision. The minutes could provide some clarification about where the majority of the FOMC is leaning towards and additional information about their deliberations. In the past meeting, the FOMC members’ median outlook for the Fed’s rate at the end of 2015 was also slightly revised down from 1.375% to 1.125%. This is another indication that even though we could still see a rate hike by the middle of the year, the pace of increase may be slower than previously estimated. A rise in the rate and the progress of the subsequent rate hikes could adversely impact the price of SLV, which tends to be related to the Fed’s cash rate. If the U.S. economy keeps showing signs of improvement, the FOMC will be more likely to raise rates. This scenario isn’t likely to play off well for SLV. For more see: Will Higher Physical Demand for Silver Drive Up SLV? Disclosure: The author has no positions in any stocks mentioned, and no plans to initiate any positions within the next 72 hours. The author wrote this article themselves, and it expresses their own opinions. The author is not receiving compensation for it (other than from Seeking Alpha). The author has no business relationship with any company whose stock is mentioned in this article.