Tag Archives: bstresource

How To Build A ‘Lifetime’ Portfolio (Step 1)

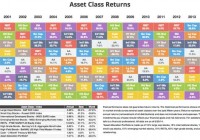
Why obsess about what will happen this coming week? That’s the job of people who get paid by the word. Why not take the road less traveled and ignore 90% of the hullabaloo?!! This is the time of year when most investment writers predict what will happen in 2015. What I’d rather offer, however, is what is “most” likely to happen this year, next year, or the next 10, 20 or 50 years. The short and glib answer is the one proffered by J.P. Morgan when asked what the market would do next. “It will fluctuate,” he replied. That may sound offhandedly dismissive of the question, but in fact there is much truth, and the beginnings of what we now call Modern Portfolio Theory (MPT) in his pithy response! Modern Portfolio has much to recommend it and much to eschew. The basic idea is solid: MPT is a way to optimize your returns based on your acceptable level of market risk. You accomplish this by diversification among various asset classes. If you can remember as far back as January 2014, almost every pundit was predicting a disastrous year for bonds, a so-so year for US stocks to digest the gains of 2013, and sector bets all over the place. I don’t know of a single analyst who predicted that the best-performing sector in the USA would be utilities, yet there they are, proudly atop all markets. The matrix below shows what asset class performed best over the past few years. (These are asset classes, not business sectors, so you won’t see utilities there, but you will see “REITs” and both “High Grade” and “High Yield” bonds, both of which are equally-interest-rate-sensitive.) If you look carefully at every year, you will note the results vary considerably. The same holds true over all other, even more extended, periods. Diversification works! Yes, you will sometimes fail to beat the market, “market” being shorthand to most investors for the “Large Caps” represented by the S&P 500, but over most periods other than an out-and-out bull romp in US stocks that means you are likely to do much better. (click to enlarge) You’ll note, for instance, that in 2000, the large caps, as measured by the S&P 500, were the 3rd- worst performing asset class. In 2002, they were “dead last.” In fact, if you look closely, you’ll note that not once was the S&P 500 the top-performing asset class – including the past 6 remarkable years! Being open to other asset classes is the heart of Modern portfolio Theory, but also the heart of Asset Allocation theory, and the heart and soul of our approach to building a Lifetime Portfolio. In a period of low and declining or stable interest rates, the aforementioned utilities, bonds and REITs often outperform stocks, and with considerably less volatility and heartburn. MPT has also become associated with the notion that, since no one can predict what will happen on any given market day (or week, month, year, etc.) why bother? Why not instead select the asset classes that give you a level of risk you are comfortable with and then get reasonable returns year in and year out? Rigorous academic research shows that you will typically come out ahead after even a few years of doing this than you will if you try to “beat the market.” To oversimplify: if your risk tolerance is low, you might create a portfolio of 40% high grade bonds, 20% REITs, 20% high yield bonds and 20% large cap stocks. If you are comfortable seeking greater returns with greater risk, you might select 10% each of high grade and high yield bonds and REITs, with the other 70% of your portfolio split among US Large and Small Caps, International Large and Small Caps, and Emerging Markets. In any scenario you construct, you want to let your profits grow while feeding the areas you have selected that aren’t doing as well. The usual way this is done is to rebalance at some defined period every year (or less). A variation of this is to pick a certain percentage, say 20%, and if one asset class gets “out of whack” by that amount you add to it if it is down, or sell off some of it if it exceeds the 20% higher than your chosen percentage allocation. If you wanted to hold 20% of your portfolio in large caps, for instance, if that asset class appreciates 20% and is now therefore 24% of your total portfolio (20% of 20 is 4), you would “re-balance” to bring that part of the portfolio back to your risk comfort level, using the proceeds to buy, at lower cost, some of the other asset classes that are “currently” lagging. Does this sound boring? It may be, but which sounds better: a 7.4% annual return over 14 years or a 4.3% return? The bottom line on the above chart is that the simplest asset allocation plan imaginable, 40% high grade bonds, 15% each U.S. large caps and international stocks, and 10% each of small caps, emerging markets and REITs, rebalanced annually, still beat the currently-in-vogue “just buy an S&P 500 index fund; active management doesn’t work” mantra. This “just buy an S&P 500 index fund; active management doesn’t work” fable becomes popular once we are well ensconced in a bull market – and dies just as quickly when the market plummets. As the data above shows, the drawdown for the S&P 500 was -37% in 2008. The biggest drawdown for the asset allocation model (AA) was -22.4%. For comparison, our Growth and Value portfolio, in which we used our own variations on asset allocation described below, was down 18.7% that year. On a million dollar portfolio, the S&P would have declined in value to $670,000; our G&V to $813,000, with less position risk and less volatility. How We Diverge From the Standard Model There are scores of ways you might select an asset allocation model that works for you, from changing the percentage allocations to increasing the asset classes to adding a little sentiment, fundamental, historic or technical analysis. We try not to sway too far from the basic principles of asset allocation. We like to think we are merely adding a dollop of common sense and placing history on our side. We believe: Rebalancing based on the calendar is folly. In the chart above, the results tabulated are for a rebalance once a year at the beginning of each year. Macro-trends evidence themselves any time of the year; both black and white swans swoop and dive based upon events, not calendars. We take action when our asset allocation percentages diverge from our intended allocation. Underlying the concept of asset class investing is the assumption that markets are efficient and that investors act rationally. We might give some credence to the first assumption, but the second is patently false! We believe we can benefit from investor emotions. An example today might be early nibbling at the huge integrated oil companies that can slash CapEx and make a profit on their current properties if the price of oil falls even another 50%. Buy them when they’re cheap; don’t obsess if something you buy for 10 times forward earnings and a 5.9% yield falls so that you “might have” bought it at 8 times forward earnings and a 6.4% yield. At times when interest rates are rising, we might be as little as 0-20% in bonds and REITs combined. When falling, we might be at 60-70%. We are dynamic, not static. [This is a very big divergence from the academics’ idea of asset allocation. That’s their way; this is our way.] “To every thing there is a season.” We augment our asset class investing to take advantage of the fact that small caps tend to enjoy the bulk of their outperformance in the first two quarters of the year, that pre-presidential election years are often excellent market years as both parties crank up the PR machines, etc. We don’t chase any single asset class like S&P 500 large caps, REITs, small caps or any other. Nor do we obsess if we fall behind in comparison to any one asset class for an extended period. We maintain our discipline and do our best to grow our portfolios steadily. Sometimes we have setbacks, sometimes we are out of sync, but we’ve always bounced back. In Part II, I will discuss the asset classes that are historically most and least correlated with the S&P 500 (U.S. large caps) and with each other, so you can begin to consider how you might construct a Lifetime Portfolio that works for you. I’ll also discuss the types of mutual funds and ETFs our research and analysis leads us to, including examples and some of our specific current holdings. As Registered Investment Advisors, we believe it is our responsibility to advise that we do not know your personal financial situation, so the information contained in this communiqué represents the opinions of the staff of Stanford Wealth Management, and should not be construed as personalized investment advice. Past performance is no guarantee of future results, rather an obvious statement but clearly too often unheeded judging by the number of investors who buy the current #1 mutual fund one year only to watch it plummet the following year. We encourage you to do your own due diligence on issues we discuss to see if they might be of value in your own investing. We take our responsibility to offer intelligent commentary seriously, but it should not be assumed that investing in any securities we are investing in will always be profitable. We do our best to get it right, and we “eat our own cooking,” but we could be wrong, hence our full disclosure as to whether we own or are buying the investments we write about.

The Consequences Of Overvaluation: A Word Of Caution To Funeral Owners And Fund Managers

The Socratic Equity Rate is one tool investors can use to identify areas of value and over-value. Compared to past levels, a high yield might indicate areas of value. Compared to past rates, a low rate indicates investors might want to be cautious. If you ever owned a diversified mutual fund or ETF, chances are, at one time you were a part owner of a funeral services business. For those running the fund, and especially for owners of shares in a funeral services business such as Service Corporation International (NYSE: SCI ), it is essential to be familiar with the Socratic Equity Rate . Developed by The Socratic Investor, the Socratic Equity Rate was designed to assist in identifying opportunity and risk in investment securities. Intended for board of directors, company management, securities lawyers, fund managers and individual investors, this proprietary equity rate is a number to understand. The Trial of Socrates | The Death of Socrates movie trailer, by educationalmovies For an investment fund manager, the higher the current Socratic Equity Rate is compared to past readings, the more attractive an investment might be. The lower the reading, the more cautious an investor should be. For another professional, the readings will be the same but the takeaway will be different. The key is to know the historical range, be able to identify anomalies, and know what to do when those areas of value or overvalue appear again. Although the last part will be different depending on what role you play in the investment world, the concept is the same . Examine the performance of Service Corporation International after SCI’s Socratic Equity Rate reached 25% in 2000. From $1.75 to $13.81, SCI’s return was one of the best in the market. At a Socratic Equity Rate near the highest recordings ever seen in SCI’s history, Service Corporation International was a buy. For a board member, a lower number might indicate a time to incentivize management to issue equity . If private companies are cheap, management would be smart to pay using overvalued equity. A deal that won’t rest in peace, by TheDealVideo Take a look at the performance of investing in SCI when the Socratic Equity Rate was near its lowest levels ever. From $10.00 to $5.08, SCI investors experienced devastating returns. At a Socratic Equity Rate near the lowest readings ever, 1%, SCI’s overvalued equity presented management an opportunity to acquire another funeral company’s crown jewels without spending cash . On the other hand, if you are a private funeral home business owner looking to sell, and the acquiring company wants to pay in stock, you better know how overvalued the stock they want to pay with is. Knowing the Socratic Equity Rate can help protect your crown jewels from theft, as what happened to Time Warner when AOL paid using tech-bubble inflated AOL shares to merge. Ted Turner’s biggest regret, by CNNMoney From a securities law standpoint, an upstanding securities lawyer might consider using this rate as a tool to defend the innocent teacher’s pension fund or university endowment fund that lost money. By exhibiting a Socratic Equity Rate near the lowest levels ever, the lawyer could argue the fund manager breached their fiduciary duty by paying a premium substantially above historical norms. Examine what could happen to a fire-fighter pension’s investment when a supposed fiduciary buys SCI at a Socratic Equity Rate of 1%, a reading that is one of the lowest on record. If the supposed,”fiduciary” keeps ignoring the Socratic Equity Rate, one day there may not be a pension for retired fire-fighters. At a level near 2.1% today, SCI’s Socratic Equity Rate is approaching the lower end of its historical readings. Fund managers and individual investors should remain defensive. Be advised, this is not investment advice. The Socratic Equity Rate is one tool out of an entire tool box of equity valuation methods. Your decision to buy, sell or sue will depend on your profession and further research is always recommended. Thanks be to YCharts, who provides The Socratic Investor with Service Corporation International financial data.

10 Reasons Why Every Serious Investor Should Read Barrons

All serious investors investing for their future should subscribe to and read this weekly newspaper. Barrons is an antidote to main-stream financial news media that carries articles with screaming headlines of euphoria or disaster that intimidates investors. Barrons uses analysis and facts in addition to speaking with some of the most respected investors on Wall Street when setting out their opinions. Barrons follows up their stock picks periodically with continued analysis as to why they were right or wrong in addition to whether such picks are still valid. Barrons provides information, market data and columns covering all aspects of the U.S. economy and markets, world markets and other useful commentary. Many years ago we knew someone who was an equity-derivatives trader on Wall Street. That trader, who made almost $1 million in a year at the age of 27, told us we should read The Economist and Barrons each week. We read The Economist for a year or so, but the volume of reading required each week was overwhelming. Then, however, we started reading Barrons and we have never stopped. Barrons’ regular subscription cost is about $200 a year, but the publisher is always running special subscription offers. Currently an investor can obtain their first 26 weeks for $1 a week. We purchased our current Barrons subscription using 1900 airline miles. However you pay for Barrons, we believe all that serious investors investing for their future should subscribe to and read this weekly newspaper that arrives on Saturday mornings. We are not alone in our appreciation for Barrons. Here are some other articles discussing why Barrons is a valuable financial resource and how a reader should use the information contained within. Why we read Barrons generally As readers of our articles know, we do not look highly upon the most mainstream of financial-news-media outlets. Mainstream financial news media includes CNBC, Fox Business News and any news feed Internet financial web site that carries articles with screaming headlines of euphoria or disaster. Such mainstream financial media is not designed to truly help individual investors in a calm and sober manner. Rather, such mainstream financial news is designed to attain large viewership numbers. In our minds, mainstream financial media is on par with tabloid journalism. Harsh? Yes, but all too true. Barrons is different in that whether their news is bullish or bearish, they do not hit the reader over the head with histrionic language. Rather, Barrons uses analysis and facts in addition to speaking with some of the most respected investors on Wall Street when setting out their opinions. In addition, they have cartoons on par with New Yorker magazine to make you smile even when your recent investment performance is making you frown. In this article, we will briefly discuss why we read Barrons specifically. 1 – Up and Down Wall Street This article basically outlines the mood of overall markets, world economies and politics. This section is valuable to establish an overall investment mood for readers. This article typically starts with outlining the previous week’s trading and then interweaves economic data, political news both American and Foreign, significant events and commentary by well-known Wall Street players to establish a current mood for past week of trading and the mood that may lead off the upcoming week of trading. Reading this article is a must. 2 – Follow up to Barrons stock picks One thing you will rarely if ever see in the majority of financial publications is a follow up to buy and sell recommendations with regard to individual stocks, industry-related groups of stocks or overall market calls. Barrons is different. Barrons periodically reviews their stock picks whether they were good or bad calls. In a Barrons follow up, they will either say why a stock continues to be a buy, sell or whether their opinion has changed based on intervening news and set out an explanation for their opinion. Accountability for opinions is a rare commodity, and Barrons willingness to stand behind their successes and failures gives us confidence to consider and act on future Barrons recommendations. 3 – The Trader This article generally begins sets out the recent week’s movements in the market indexes by the numbers and ties in news related events that may have moved the markets up or down. Quotes from well-known Wall Street veterans are frequently set out in the beginning of this article. As this article moves forward there are usually one or two specific stock recommendations that a reader may further research and then act upon. Overall this article is one we read every week. 4 – Insider Transaction filings This section, while small, sets out a small but useful section of the top 20 largest insider buys and sales for the week along with an insider transactions ratio. Although insider transactions are available in many places, we like that the information is gathered all in one small place. In addition, the insider transaction ratio is a chart that indicates whether an overall market mood is bullish or bearish based on recent insider activity. We have used this tiny section successfully as a partial basis for some of our past investment decisions. 5 – Speaking of Dividends This article is valuable in that it recounts the previous week’s dividend activity such as dividend increases, reductions or special dividends. When the previous week did not have a significant amount of dividend news, this article recounts dividend trends in the overall markets that are valuable to consider for any dividend investor. 6 – Market Laboratory Barrons is old school so to speak in that it still gathers a significant amount of economic, commodity, market index, short interest, individual stock, dividend, bond, currency, foreign market and earnings calendar data. While a reader may be able to find much of this data in other places on the Internet, in Barrons, it is all in one place. Not all of the information will be valuable to every reader. We like the earnings calendar announcements, short interest tables, weekly new high/low tables, dividend data and research reports. 7 – 13D Filings A 13D filing is a filing with the Securities and Exchange within 10 days of attaining a greater than 5 percent position of a company’s securities. This information is valuable to investors interested in high or low profile investment stakes built up in a particular company’s stock by an investment entity such as an investment group. 8 – Weekly stock profiles This article or group of articles profiles one or two stocks a week in the small, medium and large capitalization range that provides a valuable starting point for an investor to research new investment ideas. Be careful of buying too quickly though as Barrons profile articles are known to provide a bounce in a profiled company’s stock in the week or so following the profile. A profile of a stock an investor already owns is still valuable as such profile provides a continued thesis for holding a stock into the future. 9 – The weekly headline article The weekly headlines article may focus on individual stocks, industry stocks, mutual funds, economic trends, various economies around the world. This headline article may not always be of interest to a reader but still should be read for the sake of deepening one’s knowledge in regard to various topics as they relate to the U.S. or world economies. 10 – Everything else Not everything in Barrons will interest a reader, but for the sake of completeness and increasing knowledge a reader should try to read most of the articles and columns which tend to run one page or less. There is: 1) Editorial Commentary by Thomas Donlan which tends to express his quite conservative views about politics, business and the economy; 2) D.C. Current by Jim McTague which focuses on American politics and the business world also with a conservative viewpoint; 3) CEO spotlight which focuses on the CEO of a company and their life and the performance and future direction of the company the CEO heads; 4) Technology week which we believe is one of the weakest links in Barrons as this column gushes over Apple, Inc. (NASDAQ: AAPL ) on a seemingly weekly basis; 5) the European Trader, Asian Trader, Emerging Markets and Commodities Corner columns; 6) Current Yield which focuses on bonds; 7) a mutual fund or investment group and their investments along with their outlook for the U.S. and world economies; and 8) Striking Price which focuses on the options market and market volatility. There is more, but to keep this article brief we have set forth the highlights of Barrons. Conclusion We have noticed that many people who have attained some form of monetary “success” either through their own efforts or inheritance read Barrons. We read it because their analysis is intelligent, informed and rational. The articles contained within Barrons address an investor with respect and do not scream their opinions to gain attention. Barrons, however, with their long and storied history is respected, incisive, listened to and quoted on a weekly basis year after year. As such, every investor who seriously wants to succeed for their own well being should read it regularly.