Tag Archives: bstresource

Taking ETF Trades To The Next Level

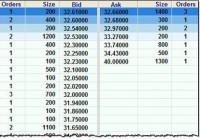
Experienced investors know the theory: ETFs are supposed to trade very close to their net asset value (NAV). And most of the time they do. But this week my PWL Capital colleague Justin Bender and I encountered a glaring exception that could have had expensive consequences. On Monday, Justin and I wanted to sell the iShares U.S. Dividend Growers Index ETF (CUD) in a client’s account. It was a large trade: more than 5,000 shares, which worked out to over $160,000. As we always do before making such a trade, we got a Level 2 quote, which reveals the entire order book. In other words, it tells you how many shares are being offered on the exchange for purchase or sale at various prices. By contrast, a Level 1 quote-the type normally available through discount brokerages-only tells you how many shares are available at the best bid and ask prices. If an ETF’s market maker is doing its job, there should be thousands of shares available at the best price. But we were surprised to find the Level 2 quote looked like this: Source: Thomson ONE Let’s unpack this. As sellers, we looked at the “Bid” column, and the best price (at the top of the column) was $32.61. But we’d be able to sell a mere 200 shares at that price, as revealed in the “Size” column to the left. We could unload another 400 for just a penny less, but after that the prices plummeted. Had we placed a limit order to sell 5,000 shares for $32.60 (one cent below the best bid price), we likely would have seen only 600 shares get sold. But that would have been a minor inconvenience compared to what might have happened if we’d placed a market order. Remember, a market order does not specify a minimum price you’ll accept when selling: it simply tells the exchange you will take whatever is being offered. Assuming a market order for 5,000 shares would have been filled according to the prices above, we would have received as little as $31.65 on the last few hundred shares-almost a full dollar lower than the best bid price. The average price for that market order would have been just $32.23, netting us proceeds of $161,150. Had we been able to sell all 5,000 shares at the best bid price-which is what we’d normally expect-we would have received almost $2,000 more . As you can imagine, we did not place this trade for our client. When market makers take a holiday This lack of depth in an ETF’s order book is very unusual. Even if an ETF is not frequently traded , market makers ensure that thousands of shares are available for purchase or sale at a price very close to NAV. So what was the reason for this anomaly? We can’t be sure, but Justin suspected it was because U.S. markets were closed on Monday (it was Martin Luther King, Jr. Day) while the TSX remained open. CUD is a Canadian-listed ETF, but its underlying holdings are U.S. stocks that were not trading that day: this would have made it more difficult for the market makers to determine the NAV of the fund. Indeed, the lot sizes were so small it’s unlikely they were posted by market makers at all: they may simply have been from individual investors. To test that idea, we got a Level 2 quote for another Canadian ETF that holds U.S. stocks: the Vanguard U.S. Total Market (VUN) . Sure enough, this one showed little market depth as well. Had you tried to sell more than 400 shares (or buy more than about 1,300) you may have seen your order filled at a surprising price. I checked the Level 2 orders for both ETFs again on Tuesday and the situation was completely different. Both funds had 20,000 to 30,000 shares available within a penny of the best bid and ask prices. Lessons learned This was a big trade that most retail investors would never make. But there important lessons from our little adventure that apply to anyone who uses ETFs. First, it’s the most dramatic example I’ve seen for why you should never use market orders . In this situation, a market order would have got you into trouble had you tried to trade as little as $20,000. On a very large trade like ours, it might have been a disaster. Second, avoid trading foreign equity ETFs when the underlying markets are closed. There are several American holidays when the Canadian market remains open, and these are not the days to be making large trades in ETFs that hold U.S. stocks. If you’re making a significant trade in an international equity ETF, it’s also a good idea to pay attention to time zone differences . Finally, if you have a large portfolio, consider subscribing to a service that provides Level 2 quotes. Check with your brokerage to see what is available, because practices vary a lot. Scotia iTRADE provides these free upon request, for example, while RBC Direct Investing and TD Direct Investing offer them as part of their Active Trader programs, and others such as Questrade charge a fee.

A Hedged ETF Strategy For Rising Interest Rates

The 10-year Treasury Yield at 1.8% is 1.2% below where it started 2014. Forecasts that rates would rise in 2014 were very, very wrong. With the 10-year yield now at a record low level, the probability of rising rates from here are better. Outlined below is a hedged strategy using short and long bond ETFs to profit from rising long term interest rates. In one of my accounts I hold about 20% in cash that I did not want to put into the equities market. My plan is to hold that money as available investment capital for the next time the equities market experiences a strong correction. In the current 0% interest on cash environment, I started to think about ways to put that money to work in a relatively low-risk way. I am also concerning about the effects of rising interest rates on the overall value of my income focused equity holdings. With the current level of interest rates paid on bonds, you need to take on quite a bit of duration to earn any meaningful rate of yield and I am unwilling to go 100% into a bond ETF with the prospects of higher interest rates somewhere in the not to distant future. In contrast, an inverse Treasury bond ETF will gain value when interest rates rise, but does not pay any income and will lose value if rates continue to decline. My research led me to try set up a combination investment of a bond ETF and an inverse Treasury bond ETF. The plan is to sell off the inverse ETF in stages as interest rates rise, reinvest the proceeds into the bond fund to generate a growing income stream from the bond ETF. The goal is to end up a few years down the road with the initial investment amount intact and all of the money in the bond ETF earning a higher yield than what is currently available in the market. Half of the cash in the account has been employed into this strategy. To put the strategy in play I initially selected the Schwab U.S. Aggregate Bond ETF (NYSEARCA: SCHZ ) and the ProShares Short 7-10 Year Treasury (NYSEARCA: TBX ) . SCHZ currently yields 2.03% with an average yield-to-maturity of 2.56%. Expenses are 0.06%. TBX is intended to provide a one-times inverse return of the Barclays U.S. 7-10 Year Treasury Bond Index and has expenses of 0.95%. Over the last year, the yield on the 10-year Treasury has declined by about 100 basis points (1.00%). For that period, the SCHZ share price appreciated by 4.50% and the TBX share price declined by 11.35%. With dividends reinvested for SCHZ you have roughly a 2 to 1 inverse return differential between TBX and SCHZ. Since I expect interest rates to increase over the next few years, my initial plan was to split the invested capital 40/60 between SCHZ and TBX. I started to leg into the two ETFs at the beginning of this year. At that time the 10-year Treasury carried a 2.12% yield, down 0.88% from where it started 2014. As the first two weeks of 2015 unfolded, the Treasury yield marched steadily lower. As the price of TBX dropped, I made two buy trades to establish an initial position. A point of interest, TBX is thinly traded and day only limit orders at or near the low end of the bid/ask spread typically get filled. When the 10-year yield dropped below 1.9%, I got more aggressive and I made two purchases of the ProShares UltraShort 20+ Year Treasury ETF (NYSEARCA: TBT ) , spread a week apart. TBT is a longer duration bond, leveraged ETF, so will change value at about 4 times the rate of TBX. With the 10-year yield setting record lows, I decided that there is an opportunity to make a relatively quick profit on an interest rate bounce off the 1.77% T-note yield bottom set on Thursday, January 15. Now with the full planned amount invested in the three ETFs, I am much more aggressively skewed towards rising interest rates than I initially planned. Here are the percentages invested in each ETF: SCHZ: 35% TBX: 48% TBT: 17% Currently, the total value of the three funds down 1.3% from the amounts invested. From this point, the plan is to profit from rising interest rates. As the share price of TBT rises, it will be sold off first with the proceeds invested into SCHZ. Even a modest rate climb back about 2% for the 10-year will turn this into a profitable trade. The SCHZ and TBX positions will be managed based on an expected slow 2-3 year rise in interest rates. Now that you’ve read this, are you Bullish or Bearish on ? Bullish Bearish Sentiment on ( ) Thanks for sharing your thoughts. Why are you ? Submit & View Results Skip to results » Share this article with a colleague

Pick Your Poison: No Return On Safety Or More Risk On Your Return

Summary Oil price moves and fluctuations in foreign exchange rates have increased the amount of risk associated with financial assets. The tail risk has increased as a result of the need for central banks to respond to oil prices and the performance of their trading partners. The size of the foreign exchange market and the amount of leverage involved make changes in exchange rates far more risky than changes in any other prices. Markets in Motion Lower oil prices are beneficial for oil consumers whether they be oil-consuming countries or consumers in the US filling up at the gas pump. That does not mean they are beneficial to financial markets. The price of a financial asset is determined by the return one expects to earn from holding the asset and the amount of risk or uncertainty associated with that return. A rapid change in any environmental factor increases the uncertainty associated with the return and therefore reduces the value of the financial asset. There have been numerous articles about the falling fortunes of the oil sector. On January 19, 2015 Barron’s presented a summary of one analyst’s estimates of how much the earnings of the S&P 500 would be reduced by the reduced earnings of the energy sector. The estimates do not seem worth quoting since they were developed without addressing the issue raised by the first sentence of this posting. While the energy sector’s earnings will be reduced, earnings in some other sectors will benefit. The net result is the introduction of considerable uncertainty into any forecasts of the profitability of a large number of companies. That uncertainty will repress stock prices. Thus, the uncertainty introduced by rapidly changing energy prices definitely has stock market implications. However, the December 17, 2014 posting entitled “Oil Prices” pointed out that the greatest macroeconomic risk associated with falling oil prices would be their impact on foreign exchange markets: “The foreign exchange markets are so big that a major dislocation there can have all sorts of unanticipated consequences.” Furthermore, it is quite conceivable that foreign exchange markets and oil markets could reinforce each other in terms of their financial market impact even when their macroeconomic impact diverges. By introducing instability, they both could be contributing to lower stock prices by increasing the risk associated with holding stocks. That can be true regardless of whether they have a positive or negative impact on the return. The December 17, 2014 posting went on to note: “One should keep in mind that financial institutions make markets in both currencies and foreign bonds. If a major financial institution gets caught with excess inventory of the wrong currencies or bonds, dislocation to the financial system could be significant.” One could argue that financial institutions also make markets in commodities such as oil, and therefore, that risk should be noted. However, as big as it seems, commodities markets are small compared to foreign exchange markets. On Jan.16, 2015 the Wall Street Journal was full of stories illustrating just how disruptive unanticipated foreign currency fluctuations can be. However, the foreign currency fluctuations were only very indirectly related to oil prices. The topic du jour was an action by central banks, current action taken by the Swiss central bank and anticipated actions by the European central bank and the Fed. Among the following articles: ” Swiss Move Roils Global Markets ,” ” Bankers, Traders Scramble to Regroup After Swiss Move ,” ” Fallout From Swiss Move Hits Banks, Brokers ,” ” Europe’s Smaller Central Banks Likely to Cut Rates After Swiss Move ,” ” Swiss Shock Tarnishes Central Banks ,” ” Swiss Bank Shares Plummet After SNB Move ,” ” Gold Shines as Traders Seek Safety From SNB’s Shock Move ,” ” Swiss National Bank’s Franc Move Buoys Dollar ,” ” U.S. Government Bond Yields Fall for Fifth Straight Session ,” and ” UBS and Credit Suisse Earnings Get a Swiss Finish ,” one gets an idea of just how important foreign currency fluctuations are. The scope includes non-oil commodity prices (e.g., gold), earnings of banks, pressures on central banks in countries like Denmark, impacts on the economies of many nations, government bond yields, stock market prices in some nations, and the reputation of central bankers. The disruption is not just restricted to turbulence in all those markets, it also involves financial institutions closing their doors (e.g., Global Brokers NZ Ltd.) or having to raise additional capital (e.g., FXCM Inc.). On January 17, 2015 the Wall Street Journal reported estimates of the losses of a number of financial institutions. The article entitled “Surge of Swiss Franc Triggers Hundreds of Millions in Losses” included estimates for Deutsche Bank (NYSE: DB ) and Citi (NYSE: C ). While the hundreds of millions of dollars involved might seem significant, for US banks they pale compared to the regulatory risk pointed out in the March 5, 2014 posting entitled “The Widows’ and Orphans’ Portfolio and US Banks.” Nevertheless, they are just one more reason to avoid US banks in a portfolio designed to have a low volatility and a stable return. Even when addressing issues that seem totally unrelated to foreign currency, it is impossible to ignore a market as large as the foreign currency market. A good illustration occurs in an article published on January 16, 2015 in the Wall Street Journal. It was entitled “What’s the Matter With Canada?” The major thrust of the article concerns Canada’s manufacturing sector, but it was impossible for the article to thoroughly address that issue without discussing the impact of oil prices on the Canadian dollar. It may well be that the decline in US stock prices so far in 2015 is an adjustment to the uncertainty introduced by the volatility in oil prices and currency markets. It certainly is consistent with the increase in uncertainty or risk associated with holding stocks. However, when foreign currency fluctuations are involved, there is a significant increase in what is known as “tail risk.” Countries can default, financial institutions can go broke, and governments can be forced to support their financial system and their economies. Such shocks are often viewed as exogenous and therefore impossible to predict. It is true; they are impossible to predict and this posting in no way constitutes a prediction that they will occur in the US. However, they are not totally exogenous and the ground is fertile for them to occur. Just that fact will impact the return on financial assets. The first half of 2015 will provide significant opportunities to investors as companies adjust to the recent volatility in oil prices and currency values. Because currency fluctuations can have large impacts on all variables from interest rates to revenue growth of individual companies, what is apparent is that regardless of what adjustments are made in a portfolio, the risk associated with any asset has increased.