Tag Archives: bstresource

So Exactly What Is Insider Trading? When Is It Unlawful? Lawful Or Unlawful, What Does It Cost You As An Investor?

A recent federal appeals court decision has consequences for investors in publicly-traded securities. The decision raises the bar for the successful prosecution of insider traders who are “remote tippees.” The decision is likely to imposes additional, mostly unquantifiable costs on many investors. Costs associated with investing in publicly-traded securities aren’t always apparent. Examples of non-apparent investment costs include (1) the expenses of your trades being “front-run” via flash orders, (2) collusive bid-ask spreads, (3) excessive executive compensation, and of course (4) seemingly small intermediary fees that in fact are unreasonably large. These costs add up. And they reduce investment returns, sometimes significantly. Another investment cost is the amount by which through an imbalance in available investment-related information between parties to a securities trade an investor pays more than he or she should to buy securities. Or receives less than he or she should to sell securities. The key word in the foregoing sentence is “should.” “Should” in this context encompasses a notion of fairness. What information should an investor expect to be available relative to the information available to the person or institution on the other side of the trade? What is fair? Recently, the influential United States Court of Appeals for the Second Circuit, in the case of United States v. Newman and Chiasson , overturned insider trading convictions of two Wall Streeters who received tips of material non-public information – third- and fourth-hand – about stocks. The Wall Streeters then traded on that information and profited. Substantially. The Second Circuit overturned the convictions because the government did not demonstrate two elements that the Second Circuit stated must exist to convict a person for unlawful insider trading: one, that the original source of the material non-public information received a personal benefit in exchange for providing illicit tips and, two, that the individuals who traded profitably knew of that personal benefit. The Second Circuit cited the United States Supreme Court case of Dirks v. SEC , 463 U.S. 646 (1983) as precedent for the required demonstration of these two elements. Despite the Second Circuit’s view that its decision only follows existing law, an upshot of the decision is that trading in American public securities markets on the basis of material non-public information will increase. There are too many gray areas in securities trading fact patterns for an increase to not result. So, if you and I as investors trade without access to that information, then with correspondingly increasing probability the person or institution on the other side of our trade will be “informationally-advantaged.” That advantage is another investment cost to you and me. How should an investor in publicly-traded securities respond to United States v. Newman and Chiasson ? As a practical matter not much can be done. (All increases in non-apparent investment costs, quantifiable or unquantifiable, further erode confidence in our public securities markets. Eroded confidence decreases the liquidity and vitality of those markets. That’s a subject for another day however.) From an optimist’s perspective here’s a suggestion, which isn’t new and just reinforces existing good investment practices: minimize the informational disadvantage – and resulting costs – by trading as infrequently as practical. Trade only to rebalance or put excess cash to work for the long term. When trading in funds such as ETFs, trade very infrequently – again, only to rebalance or put new cash to work – and try to identify funds with low internal turnover. Now that you’ve read this, are you Bullish or Bearish on ? Bullish Bearish Sentiment on ( ) Thanks for sharing your thoughts. Why are you ? Submit & View Results Skip to results » Share this article with a colleague
2014 Portfolio Review – What Strategies Worked And Didn’t Work

2014 is officially in the books. And while I don’t like to put too much emphasis on one year of performance, it’s always helpful to look at what has worked and what hasn’t worked. After all, if you want to know where we’re going, it’s often helpful to know where we’ve been. So let’s take a look at some of the more popular portfolio constructions and see how they did in 2014: Global Financial Asset Portfolio (see construction here ) Total Return: 9.24% Standard Deviation: 5.64 Sharpe Ratio: 2.13 S&P 500 Total Return: 13.46% Standard Deviation: 11.53 Sharpe Ratio: 1.74 MSCI EAFE Total Return: -4.5% Standard Deviation: 13.22 Sharpe Ratio: 0.53 MSCI Emerging Markets Index Total Return: 0% Standard Deviation: 15.3 Sharpe Ratio: 0.75 US Long-Term Government Bonds (NYSEARCA: TLT ) Total Return: 27.31% Standard Deviation: 7.49 Sharpe Ratio: 2.93 Zero Coupon Bonds (NYSEARCA: EDV ) Total Return: 42.31% Standard Deviation: 11.19 Sharpe Ratio: 2.99 Goldman Sachs Commodity Index Total Return: -31.2% Standard Deviation: 16.32 Sharpe Ratio: -1.14 Gold Total Return: -3.75% Standard Deviation: 14.16 Sharpe Ratio: -0.32 Silver Total Return: -21.68% Standard Deviation: 25.32 Sharpe Ratio: -0.96 The big winners were US stocks and bonds while the big losers were foreign stocks and commodities. As I’ve long expected, the “high inflation is coming” trade just continued to get clobbered in 2014. The Global Financial Asset Portfolio was a strong performer in general and beat most portfolios on a risk adjusted and nominal basis. Let’s see how the so-called “passive indexing” strategies performed: US 60/40 Stock/Bond Portfolio Total Return: 10.48% Standard Deviation: 6.79 Sharpe Ratio: 2.08 Global 60/40 Stock/Bond Portfolio Total Return: 3.85% Standard Deviation: 8.15 Sharpe Ratio: 1.24 Betterment 60/40 Portfolio (see here for construction) Total Return: 6.48% Standard Deviation: 7.4 Sharpe Ratio: 1.54 WealthFront Aggressive Portfolio (see here for construction) Total Return: 4.83% Standard Deviation: 11.73 Sharpe Ratio: 1.15 Boglehead 3 Fund Portfolio Total Return: 6.91% Standard Deviation: 7.21 Sharpe Ratio: 1.58 Those are some pretty surprising numbers. Given the returns of the GFAP these are all pretty poor figures with the exception of the US focused 60/40. Not surprisingly, the Robo Advisor portfolio actually result in portfolio degradation as I suspected they would when I first analyzed them earlier this year. I still fail to understand why anyone would pay 25 bps or more for these “passively” managed Robo portfolios especially given the obviously misleading claims that their portfolios generate an “estimated additional return” of 4.6% or so. They actually led to portfolio degradation of almost 4.6% in 2014. In the case of Wealthfront’s most aggressive portfolio you actually took more risk than the S&P 500 and generated about 36% of the return. I can’t stress enough how bad that result is. The process by which many of the Robo Advisors construct their portfolios leaves much to be desired and the entire process appears to be hampered by Modern Portfolio Theory style thinking….The results speak for themselves. The other big surprise to many people will be the global 60/40. At a time when 60/40 is growing in popularity it’s likely to experience serious headwinds going forward as I explained here . 60/40 just won’t generate the types of returns going forward that it has in the last 30 years. The math is pretty simple there. Same basic story goes for the Boglehead 3 fund portfolio since it’s just a slightly altered version of what I used for the global 60/40. And as I’ve shown before , even the most prominent “passive indexers” consistently underperform the GFAP. Their asset picking approach just isn’t that sophisticated, generally results in diworsification and, unfortunately, it has been trumped up mostly by strawmanning stock picking closet indexing mutual funds. But at least it beats hedge fund investing where they charge you an arm and a leg for sub-optimal performance. What about more strategically diversified portfolios? Hedge Fund Replication HFRI Fund Weighted Composite Index (NYSEARCA: HDG ) Total Return: 2.05% Standard Deviation: 4.2 Sharpe Ratio: 1.21 Harry Browne Permanent Portfolio Total Return: 9.58% Standard Deviation: 5.31 Sharpe Ratio: 1.84 Salient Risk Parity Total Return: 13.99% Standard Deviation: 17 Sharpe Ratio: 1.70 It was a pretty mixed bag for more active approaches. Closet index funds mostly underperformed (as we should all expect) and dynamic asset allocation approaches were more mixed with some beating the GFAP and others underperforming. Hedge funds did not come close to earning their fees which, like the Robo situation, leaves me wondering why people continue to pour money into so many of those strategies. This was a pretty interesting year overall. Broadly diversified portfolios did okay if you followed the GFAP construction, but many of the most popular traditional approaches such as the Boglehead 3 fund, hedge funds and Robo Advisor portfolios significantly underperformed. If you didn’t have exposure to US assets you likely didn’t perform all that well. 2014 was a year where a more dynamic approach and some degree of specific asset picking was beneficial. Of course, if you’ve read my work on active vs. passive investing you know that all of the portfolios above are “active” to some degree. Some of them are simply constructed more intelligently than others. 2015 will be no different and the investors who construct the best dynamic “asset picking” portfolios will again generate the best returns. I still think the future of asset management is a battle over low fee dynamic asset allocation approaches. It’s the best of all worlds – low fee, diversified and dynamic asset allocation.

Tactical Asset Allocation – January 2015 Update

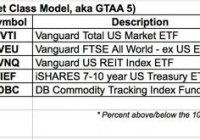
And so 2014 ends. What an interesting year from the investment performance side of things. Who would have thought long-term bonds and REITs would have led the performance rankings? I’ll have much to say about the 2014 performance of the various asset classes and portfolios throughout this month but first things first. Here is the January 2015 tactical asset allocation update. Starting with the most basic portfolios, below are the January updates for the GTAA5 and the Permanent Portfolio. There were no changes from the December update. I keep a spreadsheet online that is updated automatically. There were no changes from last month. Note: the Google sheets online are having issues updating. Seems to be an issue with Google sheets. Other bloggers are having the same problems. I did the update manually for this post. (click to enlarge) (click to enlarge) Now for the more broadly diversified GTAA13 portfolio and the aggressive versions. Online spreadsheet for this and the GTAA AGG3 and GTAA AGG6 portfolios. Same issue with this online spreadsheet as I noted above. (click to enlarge) One change this month for the GTAA13 portfolio. VWO, the emerging markets ETF went on a sell signal. Assets in that ETF should be moved to cash. The AGG3 and AGG6 updates are below – no changes for this month as well. (click to enlarge) These portfolios signals are valid for the whole month of January. Now that you’ve read this, are you Bullish or Bearish on ? Bullish Bearish Sentiment on ( ) Thanks for sharing your thoughts. Why are you ? Submit & View Results Skip to results » Share this article with a colleague