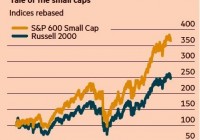
Summary ETFs are financial instruments that add an extra layer of risk that may not be suitable or ideal for all investors. Interestingly, since 2000, the S&P 600 has significantly outperformed it’s counterpart, the Russell 2000. Subconsciously, fund managers may be hurting their returns by stating they are “overweight” or “underweight” a stock, especially if using an easy to beat benchmark. Individual investors can gain an edge on professional fund managers by simply investing in indices and ETFs with a superior long-term track record. It’s conceivable that “brand names” will start to matter, as ETFs and Index Funds become more popular over the next decade. Introduction Warren Buffett has famously stated that Americans are better off investing in a simple index fund like the Vanguard S&P 500 ETF (NYSEARCA: VOO ). Investing in the S&P 500 exposes investors to American businesses and allows them to reap the benefits of an expanding and capitalistic economy. Branching away into different indices and ETFs introduces investors to varying degrees of risk and fall empty handed on the returns advertised. For example, an ETF that is composed of 30 securities is not only priced based on its underlying portfolio of securities, but also in accordance to the supply and demand of the ETF itself. This double jointed structure introduces several liquidity and volatility risks to investors in times of market turbulence and downturns. Furthermore, there are all sorts of differentiated structures that provide for excessive risk in hopes to achieve higher returns. Notably, all levered bull and bear ETFs. These structures introduce another layer of unknowns and risks for investors, with the speculative potential to increase returns. However, an investor is likely to achieve not only a lower risk profile, but higher returns by simply scrutinizing their portfolio with a careful eye– looking for an edge. The Russell 2000 vs The S&P 600 For the conservative investor, a seemingly simple question of investing in an ETF covering the Russell 2000 (like the iShares Russell 2000 ETF ( IWM)) or the S&P 600 (like the SPDR S&P 600 Small Cap ETF ( SLY)) can yield dramatically different results. As reported by the Financial Times on Monday August 17, 2015, the S&P 600 has outperformed its counterpart the Russell 2000 since year 2000–by a significant margin. Specifically, since the beginning of 2000, the S&P 600 would have turned a $100 investment into a little over $360 and a $100 investment in the Russel 2000 would have turned into approximately $250. Image Sourced from Finanical Times Hence, the framework on an underlying index can have a profound influence on an index’s performance, the related ETF’s performance, and an investor’s overall return. The S&P 600 may cover a slimmer portion of the small cap universe, but this may be for good reason. After all, an investor only needs to own 30 stocks to be amply diversified from systemic market risk. According to the Financial Times, the S&P 600 index requires companies to have a record of making profits before it is included in the index. Furthermore, it sets a far higher standard for liquidity (compared to Russell 2000). It’s no wonder then that small-cap investment firms use the Russell 2000 to track their performance against. It’s easier to beat! It’s amazing how two simple rules can create significant long-term value for clients and investors. As such, it appears reasonable to assume that an index’s brand and portfolio construction will have even more of an impact on investors’ decisions going forward. How robot advisors and, to an extent, human advisors, will account for these seemingly minute details remains to be seen. Regardless, a wise and enterprising investor will have an edge. A passive minded investor, with an enterprising spirit, would be able to increase their returns by sacrificing a small amount of time to discover discrepancies such as this-especially long-term investors who have 15+ year time horizons. Index Business Growing In Size and Power Building ETFs based on indexes has become a huge business, with hundreds of billions riding on the skirts of simple structures. The owners of these indexes, whether it’s MSCI (NYSE: MSCI ), FTSE Russell, or the S&P (NYSE: MHFI ) will continue to have more and more power and influence on the financial markets-along with their clients like Vanguard and Blackrock (NYSE: BLK ). Whether or not they use this power wisely is another question, one that I’m not overly optimistic about. Furthermore, transparency can be a double-edged sword. For instance, the Russell 2000 follows very transparent rules by alerting investors in advance which stocks will move in and out on the day each June when the index is reshuffled (making it easier to beat). The S&P 500 Index has discretion to include companies that have a history of recording a profit, maintaining a balance between sectors, and typically only includes new companies when a vacancy is created (often through a merger). Invariably this causes the stock to pop as it is added to the S&P 500 Index, creating agony among fund managers attempting to beat it. Psychology of the Index Behavior psychology (or anything to do with human behavior) continues to have a heavy influence on the performance of fund managers. It’s well-known that investors and fund managers must account for self-bias and over-confidence once they buy a particular security, otherwise their judgment may become impaired and make mistakes. Recently, there has been a change in the way fund managers and analysts talk about their portfolios. For instance, they often speak of being “overweight” or “underweight” a particular stock, rather than stating they “own” a stock. By stating that they are “overweight” or “underweight,” fund manager’s are subconsciously increasing the influence a benchmark index has on their portfolio allocation and investment returns. It’s well known that the majority of actively managed mutual funds fail to beat their benchmarks. Therefore, it stands to reason that individual investors should outperform fund manager’s who chose the Russell 2000 as their benchmark–by simply investing in the S&P 600! While past performances do not guarantee future returns, it’s hard to argue the long-term track-record of the S&P 600 compared to the Russell 2000 over the past 15 years. In essence, investors who look at a stock as a fractional ownership of an underlying business will have both a psychological and fundamental advantage over other investors during a long-term time horizon. Fund managers that state they “own” a stock are still subject to subconscious self-bias and overconfidence; however, it’s likely they would focus more of their time on the fundamentals of the business, rather than the makeup of a particular benchmark. A stock’s total return, after all, is proportional to the company’s long-term operating performance and returns on capital, not because of its weighting in a particular index. Conclusion Just like it’s never wise to ask your barber if you need a haircut, investors shouldn’t accept over-simplified financial products and investments, especially from Wall Street. A little bit of research and passion to find an edge can go a long way. Remember that in a group of 100 investors, only 49 can be better than average-despite everyone’s opinions that they are in the top 20%. Managing your time wisely and performing diligent research has the potential to add a percentage or two to your total returns over your lifetime. In addition, you will incur fewer trading and tax expenses due to mistakes and disappointments. Apply diligent research, patience, and a long-term time horizon to maximize the benefits you receive from the miracles of compound interest. Don’t let sloppy benchmark indices get in your way–invest in the best ones. Disclosure: I/we have no positions in any stocks mentioned, and no plans to initiate any positions within the next 72 hours. (More…) I wrote this article myself, and it expresses my own opinions. I am not receiving compensation for it (other than from Seeking Alpha). I have no business relationship with any company whose stock is mentioned in this article.