How Do You Look At CEF Performance?
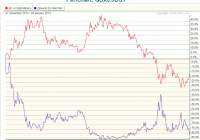
Closed-end fund GGN’s share price has felt the hit of weak gold and oil prices. But it pays out big dividends using return of capital. That makes figuring out your return more difficult than you might imagine. Closed-end funds like GAMCO Global Gold, Natural Resources & Income Trust (NYSEMKT: GGN ) and sibling GAMCO Natural Resources, Gold & Income Trust (NYSE: GNT ), two closed-end funds, or CEFs, I have written about recently are odd beasts. They trade like a stock, but are pooled investment vehicles like open-end mutual funds. That not only leads to a disconnect between market price and net asset value, or NAV, but it also makes it harder to decide how you should judge their performance. And, in the end, beauty is in the eye of the beholder on this front. The investment world’s El Camino If you’re as old as I am, or older, you remember the Chevy El Camino. It was an unusual combination of a pickup truck flatbed and a sedan/station wagon front end. Some might call at ugly, some might call it sexy, I would say it’s so weird it’s kind of cool. But, in the end, your individual judgment is what goes for you. Closed-end funds are very similar to El Caminos. That’s not the most flattering complement, but it’s true. They are a “stock-like” front end hitched up to a pooled investment medium. It’s really an ugly stepchild in the investing world, even though CEFs offer some desirable attributes. The big one that catches people’s eye is usually income. A facet of the investment space that CEFs do much better than open-end mutual funds. However, what you get may not be what it appears to be. On the surface you are getting dividends, just like any other stock. But there’s more going on than that and it changes the whole picture. When a stock pays a dividend the money is coming from what it earns (technically it comes out of cash flow). When a closed-end fund pays a distribution (note the different term) it comes out of… the income received from the securities it owns in its portfolio, proceeds from asset sales, and for some funds income from options transactions. ( This article covers some basics on distributions and return of capital, which are beyond the scope of what I’m trying to discuss here.) That’s a big difference. For example, presumably a company that just paid a dividend still has everything in place to earn more money. That’s why stock prices generally don’t fall when a dividend is paid even though the company is, technically, worth less since it just gave its shareholders a chunk of its bank account. The market’s assumption is that it can repeat the process because it’s an ongoing business. A pooled investment vehicle’s value is just the assets it owns, which are all securities. It doesn’t own machinery or patents or stores. When a mutual fund, closed-end or open-end, pays a distribution its value goes down because it just gave away part of what gave it value in the first place. Indeed, net asset value, or NAV, is just the fund’s assets divided by its share count. Give away some of those assets and the NAV has to go down. Performance So when you get a distribution from a closed-end fund how should you think about it? To be fair, it’s a part of your total return. For example, Morningstar’s trailing five-year return for GGN through year-end 2014 is about -5.5% annualized. But a quick look at a graph of GGN’s share price over that time period tells you that it was down nearly 60%. Those two numbers don’t jive. That’s because Morningstar is calculating performance as if the distributions were reinvested. It’s the same way open-end mutual funds are handled. It is, technically, the correct way to look at a closed-end fund’s performance. It’s a pooled investment vehicle, not a stock. But if you are buying a closed-end fund for income, you aren’t likely to be reinvesting those distributions. You are probably living off of them. That means you likely don’t think about performance as a mater of total return (which adds distributions to share price changes). You look at the CEF’s price as the value of what you own and distribution as income you receive, and don’t mix the two. Looked at in that way, GGN is a lousy investment-it’s down 60%! Looked at via total return, reinvesting the distributions, however, it really hasn’t been a bad performer. For example, the Vanguard Precious Metals And Mining Fund (MUTF: VGPMX ) posted an annualized loss of about -11.5% over the trailing five year period though the end of last year. That makes an annualized loss of -5.5% look much better. But that won’t matter to you if your frame of mind is to look at this investment El Camino in a different way. Beauty is in the eye of the beholder I like closed-end funds for the income they offer. They are an easy way to get professional management and income, but they aren’t perfect and they aren’t right for everyone. If you want a long-term investment that appreciates in value and pays you a large dividend, you are probably better off investing directly in stocks. Not too many closed-end funds pull that combination off. If you can get your head around total return as your benchmark, then CEFs can work for you as long-term holdings. That said, there are other ways to look at investing in CEFs. For example, trying to capture a shrinking discount when that discount gets unusually wide for some reason. That, in the end, is the play I’ve highlighted with both GGN and GNT. However, even this doesn’t change the need to get a handle on how you want to look at CEF performance and what that means for your investment approach.
