Tag Archives: basic-materials

An Overview Of A Timber And Forestry Play – WOOD

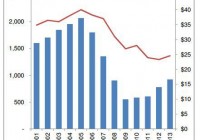
Summary Prices for timber and timber stocks are generally correlated with new housing starts. Timber and forestry stocks offer exposure to a renewable resource industry. Upticks in housing starts have not resulted in equal magnitudes of timber price gains, which suggests that price increases are forthcoming. While there are many plays for investors who wish to profit from a recovering housing market, one often overlooked alternative is timber and forestry related stocks. As I’ve said in various articles, I’m generally a fan of owning ETFs over individual holdings for their low fees and diversification, and this is no exception. One such ETF alternative is the iShares Global Timber & Forestry ETF (NASDAQ: WOOD ). This ETF offers exposure to Companies that produce forest, agricultural, paper and packaging products. According to Blackrock (NYSE: BLK ), the fund seeks to track: The investment results of an index composed of global equities in or related to the timber and forestry industry. What drives demand for timber and forestry products and services? The level of new residential construction activity. Demand for repair and remodeling. Demand for wood chips for use in paper and wood products. The U.S. Department of Housing and Urban Development released New Residential Construction statistics wednesday that were less than stellar, but nonetheless point to a moderate recovery. Key takeaways January 2015 building permits fell .7% from the revised December 2014 seasonally adjusted rate of 1,060,000, but were up 8.1% from January 2014. January 2015 privately owned housing starts were down 2% from December but up 18.7% from January 2014. January 2015 single family housing completions were 1.3% above December 2014 estimates and 9.4% above January 2014 estimates. Housing markets are regarded as somewhat choppy, with interest rates continuing to hover near historic lows at an average of 3.69% on 30 year mortgages (up from 3.59%), while stagnant wages continue to weigh on potential home buyers. Nonetheless, last month, the Mortgage Bankers Association reported that the seasonally adjusted index of mortgage applications posted the largest gain (49.1%) since the middle of the Great Recession. Homebuilder confidence fell from 57 to 55 , according to the National Association of Homebuilders release on Tuesday, but results above 50 still indicate that more homebuilders view market conditions favorably as opposed to negatively. Why invest in timber and forestry stocks? Timber and forestry stocks offer an opportunity to invest in a renewable resource. Housing starts drive timber prices. Housing starts have rebounded since 2009 lows, but sawtimber stumpage prices have not responded as quickly. (Source Rayonier Investor Presentation) Housing starts are projected to increase over the near-term, which should result in an uptick in both demand for and prices of sawtimber. (Source Rayonier Investor Presentation) ETF Overview (data as of 2/18/15 courtesy of Blackrock unless otherwise stated) Price (as of 2/18/15) $56.11 NAV Total Return YTD 5.83% Net assets $323,169,989 Inception date June 2008 Benchmark index – S&P Global Timber & Forestry Index Geographic and Industry Exposure (courtesy of Blackrock) Notes – Despite being a “global fund”, over 64% of the Company’s geographic concentration is in North America. Notes – This “sector” breakdown is a tad misleading, because as shown below, the REITs are generally focused within the Paper & Forest products industry. REITs do however, have different tax and ownership characteristics than other publicly traded securities. Top 5 Holdings as of 2/19/15 West Fraser Timber Co ( OTCPK:WFTBF ) 8.36% West Fraser Timber is an integrated wood products company that produces wood chips, lumber, LVL, MDF, plywood, pulp and newsprint. The Company operates in western Canada and the southern U.S. and trades on the Toronto Stock exchange. Weyerhaeuser REIT (NYSE: WY ) 7.99% Weyerhaeuser operates in four general segments, timberlands, wood products, cellulose fibers and real estate. According to Weyerhaeuser’s most recent annual report , the Company grows and harvests trees, manufactures and sells products made from trees, builds and sells homes and develops land. The Company’s largest market is the United States, however it has a significant customer base in Japan, Europe, China and Canada. Plum Creek Timber Company REIT (NYSE: PCL ) 7.83% Plum Creek owns approximately 6.8 million acres of timberlands across 19 states. The Company operates in the following segments, Northern Resources (timberlands in Maine, Michigan, Montana, New Hampshire, Oregon, Vermont, Washington, West Virginia, and Wisconsin); Southern Resources (timberlands in Alabama, Arkansas, Florida, Georgia, Mississippi, Louisiana, Mississippi, North Carolina, South Carolina, Texas and Virginia); Energy and Natural Resources (oil and natural gas production, construction aggregates, mineral extraction, wind power and communication rights of way); Real Estate (sales of higher and better use timberlands); and Manufacturing (lumber mills, plywood mills, medium density fiberboard and lumber remanufacturing). Rayonier REIT (NYSE: RYN ) 6.26% Rayonier owns, leases or manages 2.6 million acres of timberlands in nine states and New Zealand. The Company is the third-largest timber REIT and operates in two reportable segments: Forest Resources (harvesting of timber and other valued added activities such as leasing for hunting/mineral extraction and cell towers) and Real Estate (property sales including higher and better use). MeadWestvaco Corp (NYSE: MWV ) 4.71% MeadWestvaco is a global company that provides packaging products for the healthcare, personal care, food, beverage, tobacco and agricultural industries. The Company also produces specialty chemicals for the automotive energy and infrastructure industries. A word of caution Spectacular collapses in the housing market can result in equally spectacular collapses in timber prices and timber and forestry related stocks. If you are unsure of the general direction and momentum of the U.S. housing market, consider other natural resource alternatives. The ETF is thinly traded (average volume of less than 25,000). This can result in unfavorable bid-ask spreads. The market pricing mechanism of thinly traded ETFs is not always efficient. As recent as 2012, WOOD traded at a premium as high 1.07% to its NAV and at a discount as low as 1.16%. That spread of over 200 basis points could make the difference between a profitable trade and a loss depending on the timing of entry and exit. Disclosure: The author has no positions in any stocks mentioned, and no plans to initiate any positions within the next 72 hours. (More…) The author wrote this article themselves, and it expresses their own opinions. The author is not receiving compensation for it (other than from Seeking Alpha). The author has no business relationship with any company whose stock is mentioned in this article.
The Oil Trade Update

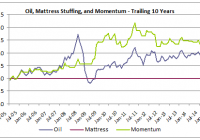
Like most risky asset classes, oil exhibits short-term momentum. Investors seeking short-term gains from timing a bounce in oil prices should understand this phenomenon, which could be reversing. After seven monthly losses for oil, momentum might finally have turned the corner, giving traders with a shorter-term horizon impetus to add positions. While evolving supply and demand factors impacting oil prices favor a longer-term value investing approach, a simple momentum heuristic could point to potential near-term gains. This is a re-purposed version of an earlier article that cautioned potential investors to take a long-term value approach to falling prices. As I have written previously, the performance of oil exhibits short-term momentum. What does that mean? On average, falling oil prices continue to fall in the short term. Conversely, rising oil prices continue to rise in the short term. Like I have done previously in articles about momentum’s impact on the returns stocks and bonds , I can demonstrate this phenomenon empirically. Understanding the power of short-term momentum can help Seeking Alpha readers more ably position oil-related exposures. Oil prices have been falling for several months, dragging down energy-related investments. With oil prices stabilizing and beginning to rebound, the negative trend from momentum could also be reversing. Imagine a world with just two asset classes – oil and your mattress. Knowing that oil exhibits short-term momentum, you invest in oil when it has produced a positive return over the trailing one month. If oil is falling, you stick your money in your mattress, earning zero. The cumulative return profile of oil, mattress savings, and a momentum strategy that toggles between oil and mattress stuffing based on which had outperformed for the trailing one month and holds that leg forward for one month is diagrammed below for the trailing ten-year period (see full results at the end of the article). Over the last ten years, if you had stuffed your money in the mattress, you would have of course earned zero. If you had purchased oil, this recent downturn would have taken you to a negative ten-year cumulative return. If you would have properly understood the momentum phenomenon, you would have more than doubled your money. (Source: Bloomberg WTI Crude) This simple heuristic to knowing when not to invest in oil based solely on trailing returns delivers tremendous outperformance. Even before the recent downdraft in oil prices, the oil/mattress momentum strategy outperformed a long-only oil strategy materially. Why? First, the countries, companies, and cartels that are major players in the global market are very large, and the forces that shape oil prices are slow-moving. Even absent the game theory inherent in supplying oil, reducing supply to the market takes time. Conversely, there is a lag effect from higher demand and prices manifesting into increased exploration via the drill bit. Secondly, short-term momentum is a powerful market anomaly present in many markets. (See Erb and Harvey (2006) on momentum impacts in commodity markets, or a litany of sourced articles I have written on the subject in other asset classes with performance proof). This does not mean that beaten-down energy stocks are a bad investment today, just that picking a short-term bottom in oil prices to generate short-term gains is a difficult proposition. If you are underweight energy stocks, then you should examine an increased allocation. As demonstrated pictorially in the chart below, buying energy stocks after a correction tends to generate very strong long-term performance. This graph shows the S&P Energy Index, replicated by the Energy Select Sector SPDR Fund (NYSEARCA: XLE ), over the trailing 25 years graphed against oil. (Source: Bloomberg, Standard and Poor’s) When I first wrote a version of this article in early December, short-term momentum suggested that oil prices and energy stocks could weaken further. Oil has fell an additional 32% over the next two months through the end of January. With oil again producing a negative return in January, the momentum strategy would again suggest that investors stay out of energy-related investments this month. My momentum strategy uses monthly calendar returns, in part because it is easier to find monthly return information historically. One-to-three month momentum with one to three month lookbacks have been shown to produce alpha across asset classes, markets, and time. Using a one-month lookback from today until mid-January and oil prices have risen by 13%. Perhaps this turnaround signals reversing momentum and further gains ahead. I have added to energy-related investments with an eye towards long-term value. Short-term momentum helped me to avoid the deepening correction. These investments have included a factor tilt towards low-cost energy focused exchange-traded funds. Given my traditional tilt towards low volatility investments (NYSEARCA: SPLV ), I was underexposed to energy pre-correction. I added broadly to closed-end high yield bonds funds, w hich were disproportionately negatively impacted by the oil drawdown . I have also added closed-end funds like Clearbridge American Energy MLP Fund (NYSE: CBA ), a pipeline focused MLP which was trading at nearly a ten percent discount to net asset value and generating a nearly eight percent yield at the time of purchase. The midstream sector is less exposed to commodity prices, and the selloff appeared to be overdone with investors selling energy-related funds indiscriminately early in the correction. A more speculative play was my add to Memorial Energy Production Partners (NASDAQ: MEMP ), an energy and production-related MLP that had strongly hedged several years of forward production as part of its business strategy, but suffered in the downturn like it was fully exposed to the commodity price drawdown. MEMP still offers nearly a 13% distribution rate even after the recent bounceback. Another long-term value play in the Energy space was my purchase of busted business development company, OHA Investment Corporation (NASDAQ: OHAI ). The company, formerly known as NGP Capital Resources is heavily exposed to the oil and gas industry with seventy percent of investments in those sectors. The company has recently brought in leading distressed debt manager Oak Hill Advisors to manage the fund. The company is trading at over a forty percent discount to net asset value. While I expect further impairments on its energy loans and a likely dividend cut, the combination of the deep discount, strong manager, inside management purchases, low leverage, and healthy liquidity all make a long-term rebound and strong forward risk-adjusted returns appear likely. Of my energy adds, this has been the worst performer thus far, but I believe downside is limited with the market capitalization trading roughly equal to the value of cash, Treasury bills, and non-Energy investments on the balance sheet. Do not be distracted by the potential for short-term losses and heightened volatility. Successful investing in oil and oil-related stocks is as simple as expanding your investment horizon. Even if you trade with a shorter-term focus, momentum could be reversing in oil given the positive trailing one-month return. Disclaimer: My articles may contain statements and projections that are forward-looking in nature, and therefore inherently subject to numerous risks, uncertainties and assumptions. While my articles focus on generating long-term risk-adjusted returns, investment decisions necessarily involve the risk of loss of principal. Individual investor circumstances vary significantly, and information gleaned from my articles should be applied to your own unique investment situation, objectives, risk tolerance, and investment horizon. Appendix on Oil/Mattress Momentum: (click to enlarge) Disclosure: The author is long XLE, OHAI, MEMP, CBA, SPLV. (More…) The author wrote this article themselves, and it expresses their own opinions. The author is not receiving compensation for it (other than from Seeking Alpha). The author has no business relationship with any company whose stock is mentioned in this article.
An Analysis Of 5 Materials ETFs

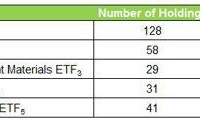
Summary These ETFs allow investors to obtain exposure to companies that provide a variety of inputs and raw materials essential to global economic function. As a whole, materials ETFs are more volatile and yield less than the S&P 500, but exceptions can be found. These funds offer varying risk and composition profiles that can be appropriate for a wide range of investors. Profiling the contenders (unless otherwise stated, market prices, NAV and SEC yield as of 1/29/15) : Vanguard Materials ETF (NYSEARCA: VAW ) This ETF seeks to track the performance of a benchmark index that measures the investment return of stocks in the materials sector and includes stocks of companies that extract or process raw materials. Market price: $104.73 30-day SEC Yield: 1.88% Number of holdings at 12/31/14: 128 iShares U.S. Basic Materials ETF (NYSEARCA: IYM ) This ETF seeks to track the investment results of an index composed of U.S. equities in the basic materials sector. It offers exposure to U.S. companies involved with the production of raw materials including metals, chemicals, and forestry products. Market price: $79.97 30-day SEC Yield: 1.67% Number of holdings at 01/28/15: 58 Guggenheim S&P 500 Equal Weight Materials ETF (NYSEARCA: RTM ) This ETF seeks to replicate as closely as possible, before fees and expenses, the performance of the S&P 500 Equal Weight Index Materials. Market price: $83.16 30-day SEC Yield: 1.45% Number of holdings at 01/29/15: 29 Materials Select Sector SPDR ETF (NYSEARCA: XLB ) This ETF seeks to provide investment results that, before fees and expenses, correspond generally to the price and yield performance of the S&P Materials Select Sector Index. Market price $47.88 30-day SEC Yield: 2.00% Number of holdings at 01/28/15: 31 Powershares DW A Basic Materials Momentum ETF (NYSEARCA: PYZ ) This ETF seeks to provide investment results that, before fees and expenses, correspond generally to the price and yield performance of the S&P Materials Select Sector Index. Market price $51.56 30-day SEC Yield: 1.06% Number of holdings at 01/28/15: 41 1) Diversification Diversification is the process of reducing non-systematic risk by investing in a variety of assets or asset classes that (hopefully) do not move up or down in value at the same time or magnitude. For the purposes of analyzing materials ETFs, I will look at both the number of holdings and also the industry diversification of constituents. a) Number of holdings An ETF does not need to hold every company of every sector that comprises its benchmark index, but 2 – 3 companies per industry is my subjective minimum to achieve adequate diversification. The basic materials sector can be broken up into roughly 20 industries including: agricultural chemicals, aluminum, chemicals – major diversified, copper, gold, independent oil & gas, industrial metals & minerals, major integrated oil & gas, nonmetallic mineral mining, oil & gas drilling & exploration, oil & gas equipment/services, oil & gas pipelines, oil & gas refining & marketing, silver, specialty chemicals, steel & iron, and synthetics. (click to enlarge) Winner: Vanguard. While some sub-sectors in the basic materials universe move in tandem, (think Oil and Gas drilling and Oil and gas marketing/refining both benefit from higher oil prices), other industries do not. Vanguard’s 128 holdings double its next closest competitor giving it the best shot at reducing non-systematic risk to an acceptably low level. b) Industry concentration Vanguard Materials ETF Courtesy of Vanguard iShares U.S. Basic Materials ETF Courtesy of BlackRock Guggenheim S&P 500 Equal Weight Materials ETF (click to enlarge) Courtesy of Guggenheim Investments Materials Select Sector SPDR ETF Courtesy of State Street Powershares DW A Basic Materials Momentum ETF Courtesy of Invesco Winner: Guggenheim. While Vanguard appears to be the most diversified with no component making up more than 25%, a closer look at captions reveals it is nearly 60% chemicals (just broken into various subcategories). Guggenheim is more balanced with three industries making up 10% or more of total weighting and while it is still heavy on chemicals, its overall chemical concentration is the lowest. 2) Expense ratio Expense ratio is the total of a funds operating expenses, expressed as percentage of average net assets. These expenses include management fees, Distribution/service or “12b-1” fees, custodial, legal, accounting, etc. Lower expense ratios, either through larger ETF size or smaller nominal expenses means higher investment returns. (click to enlarge) Winner: Vanguard, and everyone else. According to Morningstar , the average expense ratio for similar funds was 1.47%. Keeping fees and transaction costs as low as possible is something investors should always keep on the forefront of their mind. 3) Total return (click to enlarge) Winner: Powershares. I am always mentally benchmarking indexes and companies based on how they fared through and since the financial crisis. To look at that, you need to include several years before 2008. Powershares Basic Materials ETF was established in 2006, and its 3, 5 and (almost) 10 year returns (including the 2008 ordeal) are essentially on track with the S&P. That is saying something for a relatively narrowly focused ETF. 4) Valuation multiples (click to enlarge) Winner: SPDR. The SPDR ETF is trading at a discount to the S&P 500 (19.71) on a price to earnings basis. Honorable mention, iShares and Powershares whose earnings are also cheaper than those of the S&P 500. 5) Liquidity The ability to get out of a great investment is just as important as the ability to get in. While ETFs are generally regarded as having higher liquidity than mutual funds (primarily because they can be traded throughout the day, rather than just at the end), there are reasons to avoid ETFs with excessively low volume. Chief among these are higher bid-ask spreads, which may result in the inability to profitably execute a short-term trade (not a real issue for long-term investors). However, one of the issues that arises from low liquidity (a deviation between price and NAV) can actually be an opportunity. If an ETF is trading slightly below its NAV, but the market is not active enough for it to quickly resume equilibrium, you can shave a few points off your basis by looking for opportune entry points. (click to enlarge) Winner: SPDR. Higher volume means tighter bid-ask spreads, full stop. 6) Yield (click to enlarge) Winner: SPDR. SPDR is the only ETF that has a 30 day SEC yield greater than the S&P 500. The 30-day SEC yield is an annualized yield formula mandated by the Securities and Exchange Commission that is based on projected dividend yield of the fund’s holdings over a trailing 30 day period. 7) Volatility (click to enlarge) Winner: SPDR. This ETF exhibited lower volatility than all of its competitors over a three-year time frame and all but Guggenhem over five years. 8) Dividend history and growth (click to enlarge) Winner: Guggenheim. While it had a big drop off in distributions from 2010 – 2011, it has increased total distributions every year since then. Note for consideration, all of these funds pay quarterly distributions except for Vanguard, which pays annually. So, which Materials ETF should you own? SPDR! The Materials Select Sector ETF by SPDR is: the most active (liquid), the least volatile, offers the highest yield, the second lowest expense ratio, and trades at the lowest multiple of earnings. A word of caution Materials ETFs lagged the market as a whole in 2014. While last year’s losers can become this year’s winners, that is not always the case. A strong dollar can hurt the materials sector as it makes purchases of materials sector goods by foreign companies more expensive. Do your homework, review the composition and risk profile of each of these ETFs and monitor your holdings. Disclosure: The author has no positions in any stocks mentioned, and no plans to initiate any positions within the next 72 hours. (More…) The author wrote this article themselves, and it expresses their own opinions. The author is not receiving compensation for it (other than from Seeking Alpha). The author has no business relationship with any company whose stock is mentioned in this article.