Tag Archives: australia

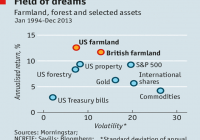
The Attractiveness Of Farmland And Other Alternative Asset Classes

Summary Over the last ten years, the returns on more exotic alternative investments like farmland, rare coins and stamps comfortably beat the returns on the S&P 500 Index. Moreover, based on a risk-return trade off, exotic alternative asset classes also come out on top. This in contrast to more traditional alternative asset classes like commodities, hedge funds, and private equity, which have performed poorly over the last decade. Finally, although investing in exotic asset classes is much less straightforward than investing in equities and bonds, there are certainly opportunities available. Recently, The Economist published an insightful graph that showed that not equities or real estate, but farmland, was the best investment in the last few decades. And, while forestry also earned a spot in the graph, The Economist could have gone a little bit further by adding other, more exotic investment classes as well. (click to enlarge) Adding Coins, Stamps and Wine No worries, with a little help from Bloomberg, I constructed an ‘Economist-like’ chart that, next to farmland and forestry, also includes fine wine, stamps and rare coins as exotic investments. To put things into perspective, I also added ‘traditional’ alternative asset classes like commodities (NYSEARCA: DJP ), gold (NYSEARCA: GLD ), hedge funds and private equity (NYSEARCA: PSP ). Equities (NYSEARCA: SPY ) and bonds (NYSEARCA: BND ) are also included. I intended to add art as well, but art is a bit of an outlier. First, who can actually afford a Monet or Van Gogh? Second, only pieces that are actually sold get to enter the leading index (Moses MEI). This implies that the most traded (and most popular) art works are overrepresented in the index. Hence, the index comes with a classical example of ‘selection bias.’ Finally, most art investment funds are scheduled to retire in the coming years. Farmland tops the list Let’s focus on the alternatives that do make the cut. The graph below shows that, over the last ten years, farmland realized the best return with an average of 17% per year. While less exuberant than farmland, the realized returns on gold, rare coins and stamps (all roughly +10% per year) are also pretty impressive. All of these alternative investments comfortably beat the 8% annual return on the S&P 500 index over the last decade. The two remaining exotic alternatives, forestry and wine, realized an average return almost equal, but also just above, that of equities. (click to enlarge) The return data lead to the straightforward conclusion that, at least over the last 10 years, these exotic alternatives performed very well. This cannot be said of the more traditional alternative investments. While ‘smart’ investors were probably laughing at you if you didn’t add any commodities, hedge funds and/or private equity to your portfolio, these investments didn’t get you anywhere from a return perspective. Private equity performed the least worst, with an average annual return of just 2%, way less than government bonds, for example. Commodities actually yielded a negative return. Of the more ‘familiar’ alternatives, gold was the only one to keep up. Risk and Return Profile So far, I have focused on return data only. However, as risk and return often go hand in hand, a ranking based on the Sharpe ratio (return divided by standard deviation) gives a more complete overview of the relative attractiveness of assets. The graph below shows the Sharpe ratios of the different asset classes over the last ten years. (click to enlarge) As much as a ranking based on the Sharpe ratio is the sounder one, the results are not that different. Most exotic alternatives rank well on their risk-return profile. Farmland, forestry and stamps take three out of the four top spots. Government bonds move up the ranking due to their low volatility. And, as before, gold is the only one of the more traditional alternative investments to do well. Hedge funds, private equity and commodities remain far behind. Based on the risk and return data, investment classes like farmland, forestry, rare coins and stamps are very attractive alternatives. However, there are a few things to keep in mind. First, a period of ten year is not that long from an investment perspective. Things could be different for other time spans (data issues arise, however, for longer historical periods.) Second, most of these exotic alternatives suffer from sticky prices (valuation changes are artificially slow). This means volatility estimates are too low in most cases. That said, the Sharpe ratios suggest it would take a serious volatility increase to push the exotic alternatives down the ranking. Investment Opportunities Now I guess many investors will anticipate another, third factor to keep in mind when looking at these exotic investment alternatives. And that is, availability. Because, how do you invest in (a diversified basket of) farmland or forestry, for example? While this question is totally legit, getting exposure to these alternatives is nowhere near as straightforward as investments in equities and bonds, there are possibilities. Some of them are actually listed. Farmland Partners (NYSEMKT: FPI ) acquires high-quality primary row crop farmland located in agricultural markets throughout North America. Adecoagro (NYSE: AGRO ) from Brazil and Cresud (NASDAQ: CRESY ) from Argentina, invest in farmland and crop production activities in South America. And there are more of these companies around the globe. They are mostly located in emerging markets, as most of the arable land can be found here. On top of that, there are dozens of private investment companies like the Hancock Agricultural Investment Group or Duxton Asset Management from Australia that also offer investment opportunities in farmland or forestry. For other exotic alternatives there are opportunities as well. For example, Stanley Gibbons Investment is a leading company focused on investing in stamps and rare coins. For wine, there is a whole range of private investment funds available. Examples are the Wine Asset Managers, The Wine Investment Fund and Lunzer Wine Investments. But there are many, many more. These companies select, buy and store a variety of wines and save you the hassle of doing this all by yourself. Hence, some of these companies do not only invest in wine but also in whole vineyards as a means of diversification. Mind you, the companies mentioned above are just examples of possibilities to invest in more exotic investment classes like farmland, stamps and wine. You should conduct your own research to find out if these companies offer investment opportunities suitable for you. Investing in these alternatives will require some serious ‘due diligence.’ But, with the disappointing returns of traditional alternative investments in mind, that effort could turn out to be rewarding! Disclosure: The author has no positions in any stocks mentioned, and no plans to initiate any positions within the next 72 hours. (More…) The author wrote this article themselves, and it expresses their own opinions. The author is not receiving compensation for it (other than from Seeking Alpha). The author has no business relationship with any company whose stock is mentioned in this article.

3 ETFs To Fight Against Global Currency War

The world is heading towards a currency war as a number of countries are choosing loose monetary policies to stimulate the sagging growth and prevent deflationary pressures. This is in stark contrast to the U.S. Fed policy of tightening its stimulus program by wrapping up QE3. The diverging central bank policies have propelled the U.S. dollar to a nine-year high. While a weak currency might provide short-term economic boost to the countries engaging in currency devaluation, this might take a toll on global trade and capital flow in the long term. A Look to International Easing Action Several countries in recent months cut their interest rates or took other actions to boost growth in their economy. The first and foremost country is Japan, which unexpectedly expanded its bond buying plan to 80 trillion yen from 60-70 trillion yen per year and tripled the pace of purchasing stocks and property funds (REITs) in October. Further, the government of Japan recently approved a spending package of 3.5 trillion yen ($29.12 billion) to boost consumer spending and regional economic activity. In November, the People’s Bank of China surprised the global market with a cut in interest rate for the first time in more than two years. The central bank slashed the one-year lending rate by 40 bps to 5.6% and the deposit rate by 25 bps to 2.75%. Further, China’s central bank lowered the reserve requirement ratio by 50 bps to 19.5%, effective February 5. Other nations also followed suit this year. The Reserve Bank of India ( RBI ) cut interest rates by 25 bps to 7.75% first time in almost two years while Swiss Bank scrapped its three-year old currency cap against the euro, which was pegged at 1.20. Meanwhile, the Bank of Canada reduced interest rates by 0.25% to 0.75%, representing the first rate cut since April 2009. The Turkey central bank trimmed one-week repo rate by 50 bps to 7.75% while Peru reduced the benchmark interest rate by 25 bps to 3.25%. Egypt too lowered the deposit rates and lending rates by 50 bps to 8.75% and 9.75%, respectively. The Danish central bank cut its deposit rate thrice in two weeks to a negative 0.35% from a negative 0.20%. The European Central Bank (ECB) launched a bond-buying program, committing to pump €1.14 trillion ($1.16 trillion) into the sagging Euro zone economy over the next one and half years. It plans to buy €60 billion of government bonds, debt securities issued by European institutions and private sector bonds per month through September 2016. Singapore announced a surprise currency policy easing, wherein the Monetary Authority of Singapore reduced the slope of the appreciation of the Singapore dollar against a basket of currencies by a percentage point. The most recent move came from Reserve Bank of Australia, which lowered interest rates by 25 bps to a record low of 2.25%. This is the first rate cut in 18 months. Further, Russia slashed the one-week repo rate to 15% from 17%. With that being said, the U.S. dollar is surging and other currencies are slumping. And investors need to be cautious when looking to invest outside the U.S. This is because a strong dollar could wipe out the gains when repatriated in U.S. dollar terms, pushing the international investment into red even if the stocks perform well in the rising-dollar scenario. How to Play? With the advent of the currency hedged ETFs, it has become easy for investors to cope with this situation. This is especially true as these funds look to strip out currency exposure to a foreign economy via the use of currency forwards or other instruments that bet against the non-dollar currency while at the same time offers exposure to the stocks of the specified nation. While there are a number of ETFs targeting specific nations, we have highlighted three ETFs that provide broad international play or exposure to more than one country. Deutsche X-trackers MSCI All World ex U.S. Hedged Equity ETF (NYSEARCA: DBAW ) This fund offers exposure to the stocks in developed and emerging markets (excluding the U.S.) by tracking the MSCI ACWI ex USA U.S. Dollar Hedged Index while at the same time provides hedge against any fall in the currencies of the specified nation. In total, the fund holds a broad basket of more than 1,300 securities with none holding more than 1.46% share. However, it is skewed towards the financial sector with 26.9%, followed by consumer staples (13.2%) and consumer discretionary (11.3%) Among countries, Japan and United Kingdom take the top two spots with at least 14 share each while Switzerland, Germany and France round off the top five with single-digit exposure. The ETF has amassed $16.3 million in its asset base while trades in a light volume of 12,000 shares per day on average. Expense ratio came in at 0.40%. The fund is up 12.2% in the trailing one-year period. iShares Currency Hedged MSCI EAFE ETF (NYSEARCA: HEFA ) For a broad foreign market play without currency risks, investors could also consider HEFA which focuses on the EAFE region – Europe, Australasia, Far East – for exposure. This product follows the MSCI EAFE 100% Hedged to USD index and is basically a holding of the iShares MSCI EAFE ETF (NYSEARCA: EFA ) with currency hedged tacked on. Financials dominates the fund’s return with one-fourth share while consumer discretionary, industrials, consumer staples, and health care also get double-digit allocation. Top nations include Japan, United Kingdom and Switzerland, while France and Germany round out the top five for this well-diversified fund. The fund has AUM of $391.2 million and average daily volume of roughly 162,000 shares. It charges 39 bps in annual fees and expenses and has added 11.6% since its debut almost a year ago. Deutsche X-trackers MSCI Emerging Markets Hedged Equity ETF (NYSEARCA: DBEM ) This product tracks the MSCI EM U.S. Dollar Hedged Index, which provides exposure to the emerging equity market and hedges their currencies to the U.S. dollar. The fund holds 460 securities in its basket, which is widely spread out across each component with none holding more than 3.86% of assets. Chinese firms takes the top spot at 22.5% while South Korea, Taiwan and Brazil round off the next three spots. From a sector look, financials accounts for the largest share at 28.6% closely followed by information technology (13.8%), telecom services (11.1%) and consumer staples (10.6%). The fund has managed $103.2 million in its asset base while trades in good average daily volume of around 162,000 shares. It charges 65 bps in fees per year and has returned 10.4% over the past one year. Bottom Line The popularity for currency hedging strategies has been on the rise on a strengthening U.S. dollar and the prospect of higher interest rates in the U.S. against lower interest rates in other countries. These products are expected to perform better than the traditional funds in the coming months thanks to the global currency war.

Higher Rates And Improved U.S. Labor Market Hold Back SLV

The price of SLV declined by 9% since its high a few weeks back. The recent Non-farm payroll passed expectations and coincided with the decline of SLV. The markets have revised up their expectations for a rate hike in mid-2015. The latest non-farm payroll report showed a better-than-expected result of 257,000 jobs gain in January – the market expectations were at 236,000. This news contributed to the latest fall in iShares Silver Trust ETF (NYSEARCA: SLV ), which lost 3.3% on Friday and nearly 9% from its high back in January 22nd. Here are the latest developments in the U.S. economy and its relation to the progress of SLV. The table below shows the relation between the changes in the non-farm payroll and the price of SLV in the past few reports. This time, the non-farm payroll came well above market expectations, which has led to a fall in the price of SLV. Another positive result was the revisions for December and November, which, combined, reached 147,000 more jobs than previously estimated. (click to enlarge) Source of data taken from Bureau of Labor Statistics The latest U.S. labor report also showed a higher-than-previously seen gain in wages – a 2.2% rise in hourly wages, which is the biggest gain since November 2008. This could be one of the main indicators that the FOMC has been looking for in determining its next move. If the recent rise in wages will put them on a higher path for growth, this could suggest the policy the FOMC has been implementing in recent years could come to an end within a few months. These recent positive results on both the number of jobs and gain in wages could bring the FOMC one step closer towards raising rates, which could, at the very least, curb down the rally of SLV. U.S. treasury yields have started to pick up again, which tends to move in the opposite direction to SLV; i.e. when yields rise, the price of SLV tends to decline. This was the case in recent weeks. Moreover, based on the latest update by the CME , the probability of a rate hike in the June meeting has increased to 27% – a month ago this probability was around 17.4%. For the July meeting, the probabilities are even higher at 50% compared to 37% a month back. So not for nothing, the market has also revised up its expectations for mid-year rate hike. But the ongoing economic slowdown and economic uncertainty in Europe could bring back down U.S. treasury yields. If yields were to resume their descent, as they did earlier this year, this trend could start pressuring back up SLV. In the meantime, the developments in Europe including the QE program and the tensions between the Greeks and the Germans over policy is likely to bring further down the Euro against leading currencies including the US dollar. Moreover, the recent decisions of Bank of Canada and Reserve Bank of Australia to reduce their cash rates are only bringing up the U.S. dollar. The ongoing recovery of the U.S. dollar against major currencies could start to adversely impact the price of SLV, albeit in recent weeks the correlations among major currency pairs and SLV were relatively weak, as indicated in the chart below. Source of data taken from Bloomberg The silver lining for silver bugs is that the strengthening of the U.S. dollar could also, down the line, start to weigh on the progress of the U.S. economy and taper down its growth. After all, a stronger dollar may reduce the competitive edge of U.S. exports, increase trade deficit and cut imported inflation. Therefore, if this trend persists, it may eventually start to have an adverse impact on the U.S. economic recovery, which could benefit SLV investors. The silver market isn’t an investment for the faint of heart, which is characterized with high volatility. The ongoing recovery in the U.S. economy is likely to keep pushing down the price of SLV. But from the other side, the global economic mess we face, especially in Europe, could bring down U.S. treasury yields and thus also increase the demand for precious metals. These two opposing forces are likely to keep SLV zigzagging in the near term. For more see: Is SLV about to change course? Disclosure: The author has no positions in any stocks mentioned, and no plans to initiate any positions within the next 72 hours. (More…) The author wrote this article themselves, and it expresses their own opinions. The author is not receiving compensation for it (other than from Seeking Alpha). The author has no business relationship with any company whose stock is mentioned in this article.