Tag Archives: australia

A Market Top? 15 Warning Signs

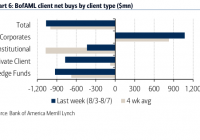
Summary Signs of a market top are evident in corporate data, respected valuation methods, economic facts, overall U.S. market price movement and investor sentiment. 15 indications that the S&P 500 is near a market top. For those who may find the evidence presented convincing, consider lowering your overall allocation to risk assets. Some investors like to take advantage of multi-asset stock hedging. The FTSE Multi-Asset Stock Hedge (MASH) Index that my colleague and I created incorporates a variety of these asset types, including zero-coupon bonds, long-duration treasuries, German bunds, gold and the Swiss Franc. Stocks are tumbling in Russia, Brazil, Chile, South Africa, Australia and Canada due to economic weakness in China. Meanwhile, the Vanguard Europe ETF (NYSEARCA: VGK ) remains roughly 5.5% off of its May high, as the feel-good effect of $1.3 trillion in European Central Bank stimulus subsides. In truth, risk assets from across the spectrum are fading . Exchange-traded vehicles as diverse as iShares High Yield Corporate Bond (NYSEARCA: HYG ), iShares Russell 2000 (NYSEARCA: IWM ), iPath Commodity (NYSEARCA: DJP ) and Vanguard FTSE Emerging Markets (NYSEARCA: VWO ) are all battling downtrends. Historically, there is a strong correlation between sharp declines in a wide variety of riskier assets and the S&P 500. Here in 2015, however, the S&P 500 has been nearly as defiant as those investors who have placed all of their eggs in the benchmark’s basket. How defiant? The S&P 500 SPDR Trust (NYSEARCA: SPY ) is a mere percentage point off of its all-time record. The popular S&P 500 benchmark has several sub-components (e.g., energy, materials, industrials, etc.) that have already succumbed to downtrends. Still, the large-cap U.S. stock proxy has held firm. On the flip side, however, a cornucopia of warning signs suggest caution. Signs of a market top are evident in corporate data, respected valuation methods, economic facts, overall U.S. market price movement and investor sentiment. Here are 15 indications that the S&P 500 is near a market top: Corporate 1. Dividends are Decreasing . According to S&P, there were 696 reported dividend increases in the second quarter of 2014. In the second quarter of 2015? Only 562. That represents a 19.3% decrease. Equally disconcerting, 57 corporations decreased their dividends in the first quarter whereas 85 companies dropped the bomb in the second quarter. Dividend decreases have now reached their highest point since 2009. 2. Questionable Accounting . Thomson Reuters is reporting that second-quarter earnings growth should come in at 1.2%. That’s relatively flat, but it is not necessarily the end of corporate profitability. Or is it? According to data from S&P Dow Jones Indices, Q2 profits should chime in at $22.85 a share. That’s down a dramatic 15.8% from one year earlier. Accounting shenanigans? That depends upon who you ask. S&P’s data employs generally accepted accounting principles (GAAP) were all expenditures are included. Thomson Reuters? They get their numbers from the analysts who often pull out costs when the corporations themselves exclude those costs. 3. Buybacks may be the Only Support . Stock buyback programs have never been about identifying attractive valuations. They’re about the short-term allocation of inexpensively borrowed capital to reduce share count, improve perceived profitability per share and gloss over revenue declines. Unfortunately, when revenue shortfall meets with higher corporate borrowing costs (a la wider credit spreads), those price-insensitive repurchase programs wind up becoming the only support for the market itself. Bank of America/Merrill Lynch recently broke down net stock acquisitions/dispositions by client type and found that corporations are the only net buyers. 4. Corporate Debt Levels Are Hitting Extremes . Are companies sitting on stockpiles of cash? Borrowed cash, and probably not as much as many folks think since so much of that cash went into buying back stock shares. Corporations are highly indebted. They’ve even increased their debt obligations by 25% since 2009. In fact, non-financial corporations are more leveraged at 37% than they were in 2007 at 34%. What happens when the borrowing costs rise on the 7-year corporate credit bonds that have been issued? Too much leverage is a probable warning sign. 5. IPOs Oh No? The last time that the S&P 500 experienced a meaningful correction of 19%-plus occurred during the eurozone crisis of 2011. Yet they battled back to end the year at the break-even point. Conversely, IPOs in the Bloomberg IPO Index fell 23.3% in the calendar year 2011. So far in 2015, the Bloomberg IPO Index has already hit a correction with declines of more than 10% year-to-date. Depreciation from the November 2014 highs is even greater. Valuation 6. Exorbitant P/Es, Forward Or Backward . Goldman Sachs recently dispelled the myth that low interest rates alone justify higher price-to-earnings ratios. According to their data, the forward 12-month P/E averaged 11.2 when real interest rates were between 0% and 1%. Forward P/E today? 16.7. Stocks would need to drop by 1/3 in value to revert to the mean. 12-month trailing P/Es, you ask? According to S&P, the index is pushing 22.2 with the recent decline in S&P’s estimates of earnings. Reversion to the mean here would also require a 33% decline in current pricing. 7. Unsustainable P/S Ratios . Ed Yardeni pegs the S&P 500 at 1.85. That’s the second-highest in history when the P/S surpassed 2.0 in 2000. With two consecutive quarters of declining sales (a.k.a. “a revenue recession”), it is difficult to see how that ratio does not get more out of whack. 8. Market Cap-to-GDP is Scary . Scores of analysts as well as investing oracles like Warren Buffett revere this valuation methodology. And why not? According to fund manager John Hussman, the indicator boasts an impressive track record of 92% accuracy with respect to subsequent 10-year total returns for the total U.S. stock market. As of this moment, the Wilshire Total Market Index market cap is roughly $21.85 trillion. That’s 125% of GDP. By this metric, the US stock market is only expected to annualize at about 0.3% with returns from dividends over the next decade. (Note: Market cap uses the Wilshire 5000 rather than the S&P 500.) Economic 9. Manufacturer Recession? We often here that the consumer represents two-thirds of the U.S. economy. It seems that many believe this renders the other one-third irrelevant. The U.S. factory sector experienced a six-month drop in its output (adjusted for inflation) as it failed to increase between November (2014) and May (2015). Meanwhile, New York-area manufacturing conditions fell so deeply in August, the -14.9 reading on the Empire State Manufacturing Survey is as poor as April of 2009. The Philly Fed’s survey’s most recent readings are consistent with the findings in the New York area, while ISM data is only representing a slowdown. 10. The Consumer Isn’t Spending Enough . Gallup data found that July was the third consecutive month when Americans spent less than they had in the same month in the year earlier. Similarly, year-over-year declines occurred in five out of the seven initial months of 2015. One would be hard-pressed to say that consumers were opening their wallets, let alone spending their gas savings windfalls. Moreover, to the extent that consumer confidence reflects purchasing habits, Gallup’s Economic Confidence Index is near 10-month lows. 11. Fed Tightening in a Weak Economic Environment? For the last three decades, every time that the Fed has tightened monetary policy, an economic slowdown or recession has come to fruition. Then, to stimulate economic confidence, the central bank of the United States resorted to conventional and unconventional tools for lowering interest rates. Bear markets were often involved. More importantly, there are two occasions in history when annualized GDP was lower than 2.5% and the Fed still decided to tighten overnight lending rates. In both instances, recessionary pressures quickened and stock bears occurred within 6-15 months. Contrarian 12. “Fear Index” Shows Little Fear . The CBOE S&P 500 VIX Volatility (VIX) demonstrates that the investing community simply does not anticipate a mammoth fall from grace. At 13.8, investors are only buying protection associated with a 6.5% drop in the next 30 days. And with the exception of a bit of concern related to Greece back in July, VIX Volatility has remained near its lows throughout the summertime. Market 13. Half of the S&P 500 Components are in Downtrends . In a healthy bull market, 75%-85% of S&P 500 stocks are above long-term trendlines and/or demonstrating upward price movement. In 2013 and in the first half of 2014, 85% of S&P 500 stocks exhibited these characteristics as shown in the S&P 500 Bullish Percentage Index. By the second half of 2014 and the early part of 2015, 75% became the new high water mark. Clearly, 3/4 participation would likely suffice in bolstering the U.S. large cap space. Since May, however, the deterioration in market breadth has meant that 1/2 the market is “bearish” and 1/2 the market is “bullish.” Historically, a breakdown in participation tends to foreshadow more severe price pullbacks for key indices. 14. Credit Spreads are Widening . Narrowing credit spreads demonstrate greater confidence in the creditworthiness of borrowers. In contrast, widening credit spreads indicate trepidation concerning the ability of corporate borrowers to service their debts. Near market tops, credit spreads are still relatively low, but they begin to rise. And this is precisely the case with respect to the 1.75% spread with BBB junk in May as opposed to the the 2.16% that we see today. Investors in lower quality junk are demanding 2.16% more over quality corporate bonds — a spread that is higher than we have seen in more than two years. 15. Flat Market Or Flat Market Plus All of the Other Stuff . According to perma-bulls, the flatness in the S&P 500 cannot tell you anything. After all, when markets were flat this far into a calendar year, they finished the year flat on one occasion, down on three occasions and higher on eight others. Batting .666 then? Perhaps not. For one thing, calendar years are not particularly instructive when it comes to bulls, bears, market tops or market bottoms. We could just as easily be talking about a July to June period or a drawn out two-and-a-half year bear (3/2000 to 9/2002). Second, and more critically, perma-bulls are explaining away market flatness as though it exists in a vacuum. It does not. It is occurring alongside plummeting commodities, plunging foreign market stocks, deteriorating small-caps, high yield bond distress, a weak economy, a less accommodating Fed, abysmal market breadth, revenue declines, earnings deceleration, extreme U.S. stock valuations and widening credit spreads. It follows that market flatness prior to 1930’s 28.5% collapse or 1941’s 17.5% correction should not be dismissed because of the Great Depression or the Pearl Harbor attack. Granted, the flatness of the market by itself may not tell us anything about what the market is likely to do. Nevertheless, when U.S. large caps are single-handedly holding on for dear life, and virtually every other indication is flashing yellow or red, market flatness is more likely indicative of the calm before the storm. For those who may find the evidence presented convincing, consider lowering your overall allocation to risk assets. As I have indicated on previous occasions, if your asset allocation target is typically 65% stock (e.g., domestic, foreign, large, small, etc.) and 35% bond (e.g, short, long, investment grade, higher yielding, etc.), you might choose to downshift. Perhaps it would be 50% stock (mostly large-cap domestic), 25% income (mostly investment grade) and 25% cash/cash equivalents. Raising the cash level and modifying the type of stock and bond risk will help in a market sell-off as well as offer opportunity to purchase risk assets at better prices in the future. In a similar vein, some investors like to take advantage of multi-asset stock hedging . Rather than using leverage, options or shorting, you consider a basket of non-stock assets that tend to do well when stocks are falling apart. The FTSE Multi-Asset Stock Hedge (MASH) Index that my colleague and I created incorporates a variety of these asset types, including zero-coupon bonds, long-duration treasuries, German bunds, gold and the Swiss Franc. For Gary’s latest podcast, click here . Disclosure: Gary Gordon, MS, CFP is the president of Pacific Park Financial, Inc., a Registered Investment Adviser with the SEC. Gary Gordon, Pacific Park Financial, Inc, and/or its clients may hold positions in the ETFs, mutual funds, and/or any investment asset mentioned above. The commentary does not constitute individualized investment advice. The opinions offered herein are not personalized recommendations to buy, sell or hold securities. At times, issuers of exchange-traded products compensate Pacific Park Financial, Inc. or its subsidiaries for advertising at the ETF Expert web site. ETF Expert content is created independently of any advertising relationships.

Canaries In The Investment Mine Have Stopped Serenading

In an effort to boost the U.S. economy, the central bank of the United States has used higher stock prices as a weapon of perceived wealth creation. Here’s the downside. When you implicitly and explicitly suggest that rates will remain lower for longer, people begin to count on risky assets being safer than they are. With all four of the classic canaries unable to serenade, the historical probability of a sharp correction for the broader U.S. market increases significantly. Eleven months ago, I talked about four classic canaries in the investment mines: (1) commodities, (2) high yield bonds, (3) small-cap stocks, (4) emerging market stocks. I explained that when all four of those canaries stop singing, riskier ETFs tend to break down. Indeed, in September of 2014, commodities were tanking, high-yield bonds were plunging, small-cap stocks were faltering and emerging market stocks were plummeting. The canaries were losing their voices. Not surprisingly, the broader U.S. markets eventually followed suit in rather dramatic fashion. In fact, everyone’s favorite large-cap benchmark (S&P 500) had nearly pulled back 10% from a record high. Then came the 16th of October. Stocks had coughed up yet another 1% through mid-day. With the broad-market benchmark pushing the 10% correction level, the president of the St. Louis Fed, James Bullard, suggested that his colleagues at the U.S. Federal Reserve could always rethink the use of additional bond buying with an extension of quantitative easing (QE). And at that time, Bullard talked about worldwide economic uncertainty being a reason for continuing “QE3.” Here’s what happened next: Today, the “Bullard Bounce” still reverberates off the walls and ceilings of the New York Stock Exchange. Why? Investors believe the Fed is willing to do whatever it takes to preserve higher stock prices. Keep in mind, in an effort to boost the U.S. economy, the central bank of the United States has used higher stock prices as a weapon of perceived wealth creation. When you pressure investors to take on risks that they would not normally have taken by pushing interest rates to ‘rarely-before-seen’ lows – and when you entice consumers to finance gratification through credit rather than through savings – asset prices rise precipitously. Higher home prices and higher stock prices make people feel wealthier. Here’s the downside. When you implicitly and explicitly suggest that rates will remain lower for longer, people begin to count on risky assets being safer than they are; similarly, the size of debts can become some so large that those who trusted the policy makers lose the ability to service the debt (let alone pay it back) when borrowing costs go up. Now let us tie together last year’s four classic canaries with the subsequent Bullard bounce and today’s financial markets. The PowerShares DB Commodity Index Tracking ETF (NYSEARCA: DBC ) has accelerated its decline since July and currently seeks depths that haven’t been seen since the heart of the Great Recession. That’s one canary that cannot sing. Meanwhile, high yield bonds via the SPDR Barclays Capital High Yield Bond ETF (NYSEARCA: JNK ) is accelerating its decline that began in June. Canary #2 has a bone its throat. Circumstances are not much better for small-cap stocks and emerging market stocks. The iShares Russell 2000 ETF (NYSEARCA: IWM ) sports a P/E of 20.6 according to Morningstar. It has fallen 6.3% from its late June pinnacle and sits slightly below its long-term 200-day moving average. In another words, Canary Numero 3 is having difficulty vocalizing. The Vanguard FTSE Emerging Markets ETF (NYSEARCA: VWO ) may provide value-du-jour with is P/E of 14, yet China’s recent currency devaluation and Russia’s oil price losses make it difficult for investors to see a forest for the trees. After all, VWO is sitting near 52-week lows and has been in a steep downtrend since May. (The fourth of the four canaries isn’t singing.) With all four of the classic canaries unable to serenade, the historical probability of a sharp correction for the broader U.S. market increases significantly. What’s more, just like the September-October pullback of 2014, market internals have been deteriorating at a noteworthy pace, whether one is looking at waning breadth of bullish stock participation or widening credit spreads between investment grade and higher yielding corporates/junk corporates. It follows that a sell-off not unlike the one that occurred in September-October of 2014 is extremely likely to transpire here in 2015. However, there are several differences this time around. For one thing, revenues have declined for two consecutive quarters, making valuations even more questionable than in 2014. In a similar vein, earnings have gone flat. Historically, stocks tend to fade when corporations are less capable of producing top-line and bottom-line results (as opposed to merely beating the analyst estimates). What’s more, this time around, there’s less certainty of the Federal Reserve defending stocks at the 10% correction level. Granted, Bullard employed a “do whatever it takes” strategy to send stocks skyrocketing last year by bringing up global economic uncertainty. It would be extremely easy for the Fed to use an excuse that economic weakness in Europe, Asia, Australia, Latin America – pretty much everywhere – requires that they tighten at a sloth’s pace. For example, they raise rates at one-eight of a point rather than one-quarter, or they execute a one-n-done quarter-point for 3-6 months. That would likely encourage risk assets to get back on track. Nevertheless, until there is clarity on Fed policy, all of the signs point to “risk-off” outperforming “risk-on.” Downside risks remain elevated until the Federal Reserve shines light on its game plan going forward. Even if the path for tightening is described as ultra-slow and measured, investors will need to weigh just how much the higher costs of borrowing might adversely impact the cost of debt servicing for corporations; that is, we may see further erosion of profitability from an earnings picture that is already flat. People, companies as well as countries tend to forget that debt is still debt. If the overall cost of servicing debt is lowered through rate games, and the debts are increased because families/corporations/nations are taking the worm on the fish hook, it does not mean that the hook itself won’t cause severe damage or death. Again, non-financial corporations are more leveraged at 37% than they were in 2007 at 34%. Higher borrowing costs from the U.S. Federal Reserve? That’s going to be more than an inconvenient challenge. Disclosure: Gary Gordon, MS, CFP is the president of Pacific Park Financial, Inc., a Registered Investment Adviser with the SEC. Gary Gordon, Pacific Park Financial, Inc, and/or its clients may hold positions in the ETFs, mutual funds, and/or any investment asset mentioned above. The commentary does not constitute individualized investment advice. The opinions offered herein are not personalized recommendations to buy, sell or hold securities. At times, issuers of exchange-traded products compensate Pacific Park Financial, Inc. or its subsidiaries for advertising at the ETF Expert web site. ETF Expert content is created independently of any advertising relationships.

Rio Tinto Is Stabbing Energy Resources Of Australia In The Back

Summary Energy Resources of Australia lost almost US$500M in market capitalization after deciding not to go ahead with the Rangers 3 Deeps zone. The company is currently processing low-grade stockpile which should keep the lights on. The company is now an excellent call option on the uranium price as it has existing infrastructure and is trading at less than $2 per pound in the ground. Introduction I’m a believer in uranium and whilst I don’t think we’ll see substantially higher prices this year or even next year, I’d still like to be positioned to benefit from an expected uptick in the sexiness of uranium-related investments. I can be patient and have been keeping an eye on several uranium companies. Energy Resources of Australia (OTCPK: EGRAF ) is one of them, and the share price has tumbled after major shareholder Rio Tinto (NYSE: RIO ) decided not to get ahead with providing financial support for the development of the Ranger 3 Deeps zone. That’s a pity, but maybe there’s an opportunity here for people who are patient. Energy Resources of Australia is a – surprise, surprise- Australian company and I’d strongly recommend you to trade in the company’s shares through the facilities of the Australian Stock Exchange where it’s listed with ERA as its ticker symbol . The average daily volume is 2.2 million shares. The company is still processing stockpiles but won’t develop the underground mine In the second quarter of this year, Energy Resources produced 390 tonnes of uranium (861,000 pounds) which would generate almost $40M in revenue based on today’s spot price. That’s still pretty decent but not a lot and that’s due to the fact ERA is basically just processing its (low-grade) stockpiles. The average grade of the processed ore in the second quarter was just 0.09% (10% lower compared to the previous quarter) whilst the total amount of ore it milled also decreased due to a planned mill shutdown. Source: annual report This is part of the plan to wind down operations at the Ranger mines and connected to the rehabilitation plan for the area. As part of its original agreement with the governments, ERA was operating the mine under the ‘Ranger Authority’ agreement which is expiring in 2021. Unfortunately this is one of the stumble blocks for the company to even consider developing the Ranger 3 Deep zone. Earlier this year, ERA has halted all development activities at the underground uranium resource as the uranium price was too low to justify spending any more cash on that part of the project. On top of that, partner Rio Tinto also pulled out, stating the project no longer meets its investment criteria. (click to enlarge) Source: annual report A real double-whammy for Energy Resources of Australia, and as you can imagine its market capitalization fell off a cliff and whereas the company was worth A$800M just three months ago, it lost 75% of that value since then! And that’s a pity, as there’s a lot of uranium down there It’s understandable nobody wants to throw tens and hundreds of millions of dollars at an underground uranium mine at a moment the uranium price is so low even the open pit mines are struggling to stay afloat. So, yes, I do understand the reasoning behind the decision to not advance the Ranger 3 Deeps zone as the result of the previously published pre-feasibility study was disappointing. The pre-feasibility study was based on an updated resource estimate using a cutoff grade of 0.11% uranium compared to a previously used cut-off grade of 0.15% U3O8. Yes, the lower cut-off grade has indeed increased the total resource base of the project which now contains 96.5 million pounds of uranium, but unfortunately this also caused a sharp 20% reduction in the average grade which dropped to 0.224%. Source: annual report This was quite disappointing as everybody knows in this investment climate it’s all about generating returns on investments and keeping the payback period short. In the past it used to be a game of ‘my resource estimate is bigger than yours’, but that era is over and investors are focusing on decent internal rate of returns. The Rangers 3 Deeps zone might not be mined in the near future, but fortunately the uranium resources aren’t running away. According to its most recent financial statements, ERA had a working capital position of A$350M (more than its current market capitalization) and this should keep the company afloat for a little bit longer. The average rock value per tonne of ore is $175/t based on the spot price and almost $250/t based on the long-term uranium price. That’s the equivalent of almost 7 g/t gold so I do believe there is value down there (literally). Investment thesis Buying shares of Energy Resources of Australia is buying a call option on the uranium price as the Rangers 3 Deeps project definitely won’t be developed at the current uranium price. It doesn’t mean the project is worthless and ERA might just ‘sit’ on it until the outlook for uranium improves again. ERA is now valued at US$1.75 per pound of uranium in the ground and that’s not expensive, considering the resource is located in a safe region. I might initiate a very small position in the next few days or weeks as a speculative bet on the uranium price. Keep in mind this company has a higher than average risk profile and even though I do think this mine will eventually be developed, there’s no way I can guarantee it will indeed happen. Editor’s Note: This article covers one or more stocks trading at less than $1 per share and/or with less than a $100 million market cap. Please be aware of the risks associated with these stocks. Disclosure: I/we have no positions in any stocks mentioned, but may initiate a long position in EGRAF over the next 72 hours. (More…) I wrote this article myself, and it expresses my own opinions. I am not receiving compensation for it (other than from Seeking Alpha). I have no business relationship with any company whose stock is mentioned in this article.