Tag Archives: articles

Critiquing Klarman

Seth Klarman wrote a very good piece for the FT yesterday on the 12 things he’s learned from Warren Buffett. Only an idiot would disagree with Klarman so, like any good idiot, I wanted to write my own version/critique of Klarman’s thoughts: 1. Value investing works. Buy bargains. CR here – Yes, value investing works. I embrace value investing where appropriate . But it’s also tremendously difficult. As Buffett has stated on several occasions, you’re probably better off not trying to do what he does. You’re better off buying low fee index funds. More importantly, you should think of “investing” as your primary source of income. The thing most people call investing is actually a reallocation of savings. Treat it like savings and avoid the gambler mentality that leads so many astray. 2. Quality matters, in businesses and in people. Better quality businesses are more likely to grow and compound cash flow; low quality businesses often erode and even superior managers, who are difficult to identify, attract, and retain, may not be enough to save them. Always partner with highly capable managers whose interests are aligned with yours. CR here – Couldn’t agree more. As Buffett has stated, surround yourself with people who are smarter than yourself. If you’re me, just surround yourself with other people. 3. There is no need to overly diversify. Invest like you have a single, lifetime “punch card” with only 20 punches, so make each one count. Look broadly for opportunity, which can be found globally and in unexpected industries and structures. CR here – I think this is great advice in your personal life. I always talk about how real “investments” are made in our primary source of income. Don’t diversify there. Do one thing and do it well. Your savings, however, should be treated like savings. Diversify it broadly across many asset classes so it protects you from purchasing power loss and permanent loss, but don’t take so much risk here that it creates instability in your ability to plan for your financial future. 4. Consistency and patience are crucial. Most investors are their own worst enemies. Endurance enables compounding. CR here – Brilliant. You are own worst enemy. Educate yourself, create a process/plan and get out of the way. 5. Risk is not the same as volatility; risk results from overpaying or overestimating a company’s prospects. Prices fluctuate more than value; price volatility can drive opportunity. Sacrifice some upside as necessary to protect on the downside. CR here – Risk is the potential that we won’t meet our financial goals. Most of us don’t need to waste time looking at individual firms that have already been scoured by the smartest investment bankers and investment managers on Earth. If we beat inflation and do so without creating excessive permanent loss risk then we are beating most of the people engaged in the investment world. 6. Unprecedented events occur with some regularity, so be prepared. CR here – In other words, diversify so that you protect yourself not only from the unknown, but from your own stupidity. 7. You can make some investment mistakes and still thrive. CR here – you won’t just make some mistakes. You will make consistent mistakes. The goal is to engage in a strategy that exposes you to high probability of positive outcomes. Losses are part of the process. Learn from them and improve the odds of your future processes. 8. Holding cash in the absence of opportunity makes sense. CR here – as Buffett says, think of cash like a call option. A little bit of cash provides you with flexibility, permanent loss protection and the ability to contribute consistently to a broader plan. Your savings portfolio needs to be fed. Feed it consistently so it gets nice and fat. 9. Favour substance over form. It doesn’t matter if an investment is public or private, fractional or full ownership, or in debt, preferred shares, or common equity. CR here – think macro, not micro. Different asset classes are a function of differing legal structures and behaviors. When pieced together correctly they should complement one another even if they don’t always agree with one another. 10. Candour is essential. It’s important to acknowledge mistakes, act decisively, and learn from them. Good writing clarifies your own thinking and that of your fellow shareholders. CR here – in other words, write a financial site where you critique people who are much smarter than you are. 11. To the extent possible, find and retain like-minded shareholders (and for investment managers, investors) to liberate yourself from short-term performance pressures. CR here – if your investment manager doesn’t eat his own cooking then maybe they shouldn’t be cooking for you. 12. Do what you love, and you’ll never work a day in your life. CR here – don’t do what you love. Do something other people will love you for doing. Good capitalists serve themselves best by serving others.
Top-Ranked ETF Wealth-Builders Now

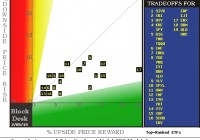
Summary ETFs provide diversification defenses against specific-issue calamity, while providing thematic focus on general investment opportunity notions – maybe good reward~risk tradeoff. Same argument for leveraged long broad-market ETFs. Using wealth-building objective strategy to rank ETFs provides ability to compare attractiveness of many, varied investing themes at one point in time. Here are 30+ ETFs at present price-based Market-Maker expectations for coming prices put to such a comparison. What is the wealth-building strategy? An active-investment one, minimizing required capital holding periods while seeking high odds for profitable outcomes. It is based on prior experience of applying the strategy, which pits Market-Maker [MM] upside price change prospects, derived from their specific issue hedging actions, against worst-case price drawdown encounters. All prior forecasts with price upside to downside outlooks like the present are subjected to a regimen of buy at the next market day close and sell upon reaching the forecast upside price, or no later than 3 months after the forecast day, regardless of gain or loss. The ranking requires at least a two to five year daily history of forecast price ranges and observes the frequency of profitable results of the regimen described above on all forecasts like today’s. The win-loss ratio proportions are applied to the upside price change forecast and the average worst-case price drawdowns encountered during prior holding periods. That net reward-minus-risk result is multiplied by the number of prior forecasts to get a figure of merit for ranking purposes. This proof-of-the-pudding approach keeps our taste restricted strictly to the objective of accumulating capital in the most time-efficient way. The following picture shows how the upside forecast rewards (horizontal green scale) compare to the historical risk exposures (vertical red scale) for over 30 best-ranked ETFs at last night’s close. Figure 1 (used with permission) The R~R map’s identity numbering has no particular significance. The presence of leveraged long market indexes is notable. Among ETFs their leverage is clearly a plus. The diversity of focus among the top ETFs is instructive: But there are other dimensions that matter. Here in ranked order are their details: Figure 2 (click to enlarge) The table of Figure 2 takes on the format of our daily “topTen” ranking of all 2500 or so stocks, indexes and ETFs that provide sufficient hedging data to reasonably imply the price ranges justifying the price protection being bought by market-makers. The averages rows in blue at the bottom of Figure 2 are to offer perspective of how these 30 “best” ETFs compare with other market investment alternatives at present. Of the daily overall rankings, today’s other 20 best have substantially stronger upside prospects (6) of 11 1/2%, compared to the ETFs +7.2%. But the ETFs demonstrate shorter average holding times (10) needed to reach sell targets, about 6 weeks, compared to 7 weeks for the best single-company securities, and 9+ weeks for the entire population and the usual market-metric of the S&P 500, the SPDR S&P 500 Trust ETF (NYSEARCA: SPY ). But both “best” lists average wins in 9 out of ten prior commitments following prior forecasts like today’s. Please remember that this is not a durable appraisal of long-term prospects for these securities. Instead, it is a scorecard, of the moment, of the likelihood of market-price movements in coming days, weeks and a few months, as seen by investment professionals with fairly short time horizons. The rankings can be impacted heavily by current market price changes, and will certainly be different a week from now. By design of strategy, none of these ETFs purchased tomorrow should still be still among holdings the first week of May, and many will have had two closeouts of the employed capital in that period. The price range forecasts in the first two data columns (2) and (3) of Figure 2 set the balance of upside to downside price change prospects shown in (7). The selection of prior forecasts with similar balance (12) is where the historic norms in (8) through (11) come from. The ranking is scored in (15), with other qualitative measures in (13) and (14). Conclusion All 30 of these ETFs have good wealth-building promise at this point, with strengths in different dimensions which may have particular preferencing appeal for different investors. But for all those with a wealth-building objective, the strategy is continuing, repetitive, active investing attention, in a series of small bites with a high percentage of profitable transactions to a small proportion of unsatisfactory ones. Careful management of time invested, along with capital, is what produces growth at rates often regarded by the less careful as impossible to achieve without taking dangerous risks. Quite the contrary, the growth comes from having an informed perspective and a solid, active discipline within which to monitor and continually renew accomplishments. Disclosure: The author has no positions in any stocks mentioned, and no plans to initiate any positions within the next 72 hours. (More…) The author wrote this article themselves, and it expresses their own opinions. The author is not receiving compensation for it (other than from Seeking Alpha). The author has no business relationship with any company whose stock is mentioned in this article.

Dividend Aristocrats + Equal Weighting Has Beat Market For 14 Of 15 Years

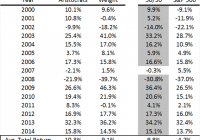
Summary Two factor tilts from the S&P 500 – the Dividend Aristocrats and Equal Weighting – have historically beat the benchmark gauge. Combining these two indices in equal proportions has beat the S&P 500 in all but one year of the twenty-first century. Strong performance in different market environments helps the combination outperform through the business cycle. In a recent series of articles, I highlighted five strategies for buy-and-hold investors that have historically beat the market. The Dividend Aristocrats , S&P 500 constituents which have paid increasing levels of dividends for at least twenty-five consecutive years, have produced a return profile exceeding the broader market by 2.5% per annum over the past twenty years while exhibiting only three-quarters of the return volatility. The S&P 500 Dividend Aristocrats ETF (NYSEARCA: NOBL ) closely replicates the Dividend Aristocrats. The S&P 500 Equal Weight Index is a version of the S&P 500 where the constituents are equal weighted as opposed to the traditional market capitalization weighting of the benchmark gauge. Guggenheim S&P 500 Equal Weight ETF (NYSEARCA: RSP ) replicates this alternative weight index. When the equal-weighted version of the index is rebalanced quarterly to return to equal weights, constituents which have underperformed are purchased and constituents which have outperformed are reduced, a contrarian strategy that has produced excess returns relative to the capitalization-weighted S&P 500 index over long-time intervals. Equal-weighting also gives an investor a greater average exposure to smaller capitalization stocks, a risk factor for which investors have historically been compensated with higher average returns. Index returns for the Dividend Aristocrats and the Equal Weight Index are detailed below. I compare a 50-50 weight of the two indices versus the total return of the S&P 500. Source: Standard and Poor’s; Bloomberg The Dividend Aristocrats produced a disproportionate amount of their relative excess return versus the S&P 500 in falling markets (see 2002, 2008), and the equal-weighted index produced its relative excess returns in rising markets (see 2003, 2009), combining their return profiles produces a risk profile that exceeds the broader market with less variability of returns . Combining these two strategies in equal proportions has bested the S&P 500 in fourteen of the past fifteen years. Singularly, the Dividend Aristocrats have beat the S&P 500 in eleven of the past fifteen years, and the Equal Weighted Index has beat the S&P 500 in twelve of fifteen years, but combining the two passive strategies in equal proportions has led to even more consistent outperformance. How good has the outperformance of this strategy been? Any active fund manager beating the market for 14 of the last 15 years would have made himself a lot of money. The geometric average return of this strategy (+9.81% from 2000-2014) beat the S&P 500 (+4.24%) by nearly 6% per year while exhibiting lower return variability. Over this historically weak period for stock returns, a dollar invested in this strategy in 2000 would be worth $4.07 today while a dollar invested in the S&P 500 would be worth less than half that figure, just $1.86, even with stocks near all-time highs. Critics of this strategy would point out that from 1990-1999, the S&P 500 outperformed a fifty/fifty mix of the Dividend Aristocrats and the Equal Weighted Index by 2.92% per year. I would counter that this outperformance by the broad market gauge was entirely generated by the S&P 500 returns in 1998 and 1999. High flying returns of tech stocks, which were not represented in the Dividend Aristocrats because of the long tenor inclusion rules, benefited the capitalization-weighted index. These two years marked the peak of the tech bubble, which subsequently unwound itself between 2000 and 2002 when the market produced three negative returns in a row. Taking out 1998 and 1999 from this dataset, and a combination of the Dividend Aristocrats and Equal Weighted Index still outperformed the S&P 500 between 1990 and 1997 (geometric average return of 16.98% vs. 16.63%) with slightly lower variability of returns. I am pretty confident in saying that over the next fifteen years, a combination of the Dividend Aristocrats and the Equal Weighted Index will have lower variability of returns than the broader market. Because the Dividend Aristocrats Index is populated by companies that are able to return increasing levels of cash to shareholders through both the peaks and valleys of the business cycle, this index has lower drawdowns in weak markets. In each of the years that the S&P 500 produced negative returns in this sample period, the Dividend Aristocrats outperformed. Combining the Dividend Aristocrats with the equal weighted index, which tends to outperform the market when it is sharply rising, provides a diversification benefit. If we believe that this strategy will have lower relative risk to the broad market, will this strategy continue to generate excess returns? I believe that the Dividend Aristocrats will produce excess returns when adjusted for their lower risk over long-time intervals. This strategy effectively overweights these high quality companies, capturing the Low Volatility Anomaly , and missing S&P 500 constituents who go out of business. I am sure that some astute readers will note that the Dividend Aristocrats have outperformed the combination with the Equal Weighted Index over the entire dataset. While their risk-adjusted performance will remain strong, I do not expect that low volatility stocks, like the Dividend Aristocrats, will necessarily continue to outperform the broader market on an absolute basis. The Dividend Aristocrats have now outperformed the S&P 500 for six of the past seven years, and the market might be catching up to the idea that lower risk stocks are worth a premium, especially in uncertain market environments and a yield-starved world. Equal-weighting the stock constituents provides an uncorrelated source of alpha. As I have written before, equal weighting the S&P 500 constituents is an alpha-generative contrarian strategy that also more effectively captures the “small(er) cap premium” than the capitalization weighted S&P 500, and I think that this part of the strategy will be an increasing component of its outperformance prospectively. For passive investors who want broad market exposure, understanding that changing your index weightings to a combination that overweights dividend growth stocks and equal weights the broad market benchmark has historically produced higher average returns with lower variability of returns. That’s the alpha we are seeking. Author’s Postscript A previous version of this article has index return data back to 1990. Disclaimer : My articles may contain statements and projections that are forward-looking in nature, and therefore inherently subject to numerous risks, uncertainties and assumptions. While my articles focus on generating long-term risk-adjusted returns, investment decisions necessarily involve the risk of loss of principal. Individual investor circumstances vary significantly, and information gleaned from my articles should be applied to your own unique investment situation, objectives, risk tolerance, and investment horizon. Disclosure: The author is long RSP, NOBL. (More…) The author wrote this article themselves, and it expresses their own opinions. The author is not receiving compensation for it (other than from Seeking Alpha). The author has no business relationship with any company whose stock is mentioned in this article.