Tag Archives: articles

USO: Don’t Be Fooled By Minor Corrections

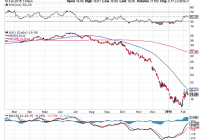
Summary After months of straight declines, oil prices seemed to bounce back starting in February. An increase in the RSI, though encouraging, is still not indicative of a broader correction. The 50-day moving average seems to be a resistance line. Oil production is still increasing. Since topping around June, oil prices have been in a steady and precipitous decline. Though the reasons have been speculated upon (mainly the debate is whether this is caused by low demand or high inventory), what is more important for speculators in the oil market is where prices are going. Around the beginning of February, prices have reversed their long and persistent decline by finally showing a rally. While this gives hope to many investors, especially those who bought oil companies hoping for a quick recovery, there are signs that there is still more pain to come. RSI and Technical Expectations (click to enlarge) To follow oil prices and technical indicators, I have shown a chart of the United States Oil Fund (NYSEARCA: USO ). A clear downtrend is apparent starting in June and continuing all the way to January. Since last month, the decline slowed noticeably, and starting in February, there is a decent correction forming. While the recent price increase is a case for optimism, a closer analysis reveals that the bear market may not be hibernating quite yet. Firstly, in bear markets, RSI tends to oscillate between 10 and 60. RSI is currently at around 50, and for real hope that this market is over, a value over 60 has to be there. Secondly, the most recent prices are showing that the 50-day moving average is unable to be surpassed, as USO hit that value, but then retraced after touching it. That said, a breakout is still possible, but with RSI hitting a wall below 60 and the price retracing at the 50-day moving average, the bear market is still well in place. Minor corrections are a part of bear markets, and this minor correction seems like exactly that, not a breakout. Fundamental Expectations The biggest factor that analysts are looking at right now is oil production. Once production finally decreases, we may then finally see the price of oil increase. While rig count can give a clue about production, it is not itself production, and production can still increase while rig counts are falling. Thus, the recent analysis by Citigroup ought to be concerning for any oil investors. It recently stated that: Despite global declines in spending that have driven up oil prices in recent weeks, oil production in the U.S. is still rising, wrote Edward Morse, Citigroup’s global head of commodity research. Brazil and Russia are pumping oil at record levels, and Saudi Arabia, Iraq and Iran have been fighting to maintain their market share by cutting prices to Asia. The market is oversupplied, and storage tanks are topping out. The same article noted that prices could fall as low as $20 per barrel. Clearly, these analysts are not buying this recent correction, nor should you. The low prices are here, and they are not going anywhere quite yet. Should We Trust Citigroup’s Analysis The question then becomes whether Citigroup is offering valid analysis, or is simply trying to change market sentiment to its benefit. To answer this question, I looked at the U.S. Field Production of Crude Oil offered by the EIA. (click to enlarge) The large increase in production since 2010 is obvious. The question now is whether US producers have taken steps to cut production now that oil prices have fallen so dramatically. To this end, a graph of year-over-year changes in production is shown. (click to enlarge) Clearly up to the latest data taken, no slowdown is found. In fact, not even a loss of momentum is apparently present. Production is increasing as quickly as it ever has, and based on this data, production is still not declining. December and January may show changes, but clearly the oil industry has a long way to go if production is going to be significantly cut in response to oil prices. Summary and Action to Take Oil is definitely not for the faint of heart right now. While I am uncertain about whether prices will actually fall to $20, I am fairly confident that oil prices are not poised for a sustainable rise quite yet. I would stick clear of USO for now, though outright shorting seems like an excessively risky move. Conversely, now would be a great time to load up on oil companies that are well poised to weather this low price environment. The way I would do this is with companies that have low debt and a good coverage ratio on their dividend. Helmerich & Payne (NYSE: HP ) is a great way to play a future correction, as it has very low debt and a current yield above 4%. There are other great companies to play the correction, though even staying put would be apt until we see further evidence that prices should rise. I would wait until production starts to decrease before investing in USO. Disclosure: The author is long HP. (More…) The author wrote this article themselves, and it expresses their own opinions. The author is not receiving compensation for it (other than from Seeking Alpha). The author has no business relationship with any company whose stock is mentioned in this article.
Wisconsin Energy (WEC) Q4 2014 Results – Earnings Call Webcast

The following audio is from a conference call that will begin on February 11, 2015 at 02:00 AM ET. The audio will stream live while the call is active, and can be replayed upon its completion. Are you Bullish or Bearish on ? Bullish Bearish Neutral Results for ( ) Thanks for sharing your thoughts. Submit & View Results Skip to results » Share this article with a colleague

It’s Time To Get Long Volatility

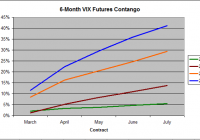
Contango-associated rollover losses have traditionally made holding volatility ETFs for more than a few weeks a dangerous proposition. Over the last two months, however, the VIX futures strip on which volatility ETFs are based has flattened reducing the expense of holding funds such as VXX and TVIX. There is an inverse relationship between VIX price and magnitude of contango. A VIX Risk/Reward score can be used to pinpoint ideal entrypoints for a buy-and-hold position in volatility ETFs. With a current value I have written multiple articles over the past 6 months- Here , Here , and Here -advocating shorting volatility ETFs to take advantage of monthly rollover losses. Recent develops in the VIX Futures market on which volatility ETFs are based, however, has made the sector more attractive as a longer term buy-and-hold position. Anybody who has traded volatility ETFs over the past five years knows that there is a constant uphill battle against the forces of contango. Volatility spikes can generate tremendous short-term gains in these ETFs, but the funds tend to underperform dramatically while awaiting these surges in volatility. While the volatility ETFs are traditionally associated with the VIX-the S&P 500 volatility index-the funds actually hold near-term VIX futures contracts. These contracts expire on a monthly basis and the fund must sell all of its front month contracts and role those funds over into the next month’s contract prior to expiration. Since the market bottom in March of 2009, these later month VIX futures contracts have been persistently more expensive than the front-month, expiring contract, a situation known as contango. This is not that surprising as volatility has been historically low as the markets have rallied these past five years keeping near term volatility low while the prospect of a future market correction has forced investors to pay premiums for later contracts. Unfortunately, this phenomenon has been devastating to short term volatility ETFs such as the iPath S&P 500 VIX Short-Term Futures ETN (NYSEARCA: VXX ) and the leveraged VelocityShares Daily 2x VIX Short-Term ETN (NASDAQ: TVIX ). Each time a fund roles over to a new contract that is in contango, it can buy fewer shares than it just sold, and over time, this results in a significant underperformance of the ETF versus the futures market on which it is based. In 2013, for example, the VIX front month futures lost 10.6% as volatility continued its decline while VXX was down a massive 62%. The 2x leveraged ETF TVIX fared even worse, down 89.8% versus a predicted loss of 21.2%. It is for this reason that I argued for shorting VXX and actively avoiding TVIX as a long term investment in previous articles. Over the past month or two, however, the VIX Futures pattern has evolved to one that I believe to be much more favorable to longer-term traders. Figure 1 below shows the % premium of each contract in the six-month VIX Futures Strip for February 2015 through July compared to the same period in 2014, 2013, and 2012. (click to enlarge) Figure 1: 6-Month Contango 2012-2015 (Source: Yahoo Finance Historical Quotes) It is clear that there has been a flattening of the VIX futures curve in 2015 versus previous years meaning that rollover losses will be limited for volatility ETFs. As of Friday’s close, holding VXX for the next sixth months would result in just a 5.5% rollover-associated loss, assuming no change to the Futures Strip. This compares to a 14% projected loss during the same period in 2014, 29% in 2013 and a disastrous 41% in 2012. Holders of the leveraged ETF TVIX can expect these losses to be doubled. However, this only tells half of the story. There is an inverse relationship between VIX future price and contango. Figure 2 below shows a scatterplot of front-month VIX price against 6-month contango using data for the past five years. As the price of the front-month VIX contract increases, the level of contango tends to decrease. In fact, once the VIX futures reach a certain level-somewhere above 20–the contacts tend slip into backwardation, the opposite of contango in which rollovers actually benefit the longs. (click to enlarge) Figure 2: Over the last 5+ Years, as VIX Futures Price decreases, Contango tends to increase (Source: Yahoo Finance Historical Quotes) At the same time, however, higher VIX levels have a much higher probability to mean revert to the average VIX level, which, over the last 5-years is somewhere around 18, as the market rallies. Figure 3 below shows the average peak six-month return based on the front-month VIX futures contract based on initial VIX starting price. (click to enlarge) Figure 3: Average Peak 6-month return by VIX range (Source: Yahoo Finance Historical Quotes) When the VIX price is less than 12, the average peak six-month return is over 100%, which stabilizes at around 35% between 14 and 20, and then slows to less than 8% when the front month VIX futures is above 30. What is needed, therefore, is a balance between a low VIX entry price while maintaining as minimal level of contango as possible. Sure, a cheap VIX may mean the possibility of a large return on a VIX spike, but you will pay for it through steep rollover losses awaiting for that singular moment. On the other hand, an elevated VIX means that rollover losses will be minimal and it will be cheap to hold the ETF for an extended period of time, but the probability of profiting from a spiking VIX will be much more limited. Overlaying the data from Figures 2-representing the expense curve-and Figure 3-representing the returns curve-produces the chart shown below in Figure 4. This graph implies that at VIX futures prices when the returns curve is greater than the expenses curve, the risk-reward profile is in favor of the longer term holder (that is, out to six-months). However, once the curves intersect at around 22, projected expenses equal projected returns and a buy-and-hold trade is no longer worthwhile. (click to enlarge) Figure 4: Historical projected 6-month return and expenses by VIX range (Source: Yahoo Finance Historical Quotes) This is a good theoretical exercise, but relies on historical averages. What does the current picture look like? A cheap VIX/low contango metric can be calculated simply by multiplying the absolute value of the contango (or backwardation) by the current front month VIX futures contract price. The lower that this number is, the greater the potential for profit while limiting rollover losses. Figure 5 below shows this VIX Risk/Reward Score over the past five years. (click to enlarge) Figure 5: VIX Risk/Reward Score Over the past 5+ years where lower values suggest favorable buying opportunities (Source: Yahoo Finance Historical Quotes) As of Friday’s closing front-month VIX Futures price of $19.18 with a six-month contango of 5.5%, the VIX Risk/Reward Score is 1.05 which, as figure 5 illustrates, is well below the 5-year average of 3.78, indicating a good risk/reward for going long volatility. Indeed, Friday’s close is in the 92nd percentile indicating a historically low score. This effectively allows us to take the projected VIX Expenses curve in Figure 4, which shows an historical average of about a 25% 6-month contango-associated loss at current levels, and shift it downward to match the current 5% projected loss. The proof, as they say, is in the pudding. The VIX risk/reward score has been