Tag Archives: articles

Otter Tail Corporation: Unofficially Nudging Forward

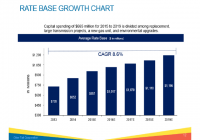
Otter Tail Corporation reported 2015 second quarter results on August 3rd. Based on its performance, the company unofficially increased its full-year EPS projection. Six months in, the company’s potential to cover both its annual dividend and corporate costs looks solid. Even considering Otter Tail traditionally pays a dividend exceeding the average of diversified utilities, the company’s share price is not yet out of fair value range. The allure of owning a diversified utility is the blend of a stable, healthy dividend and the potential of share price appreciation. Otter Tail Corporation (NASDAQ: OTTR ) operates as an electric utility in northern states in the Midwest and as a manufacturer of plastics, PVC pipe and metal fabrication. The company reported second quarter results on August 3rd. After a first quarter reset 9% to 10% downward of full-year estimates, the company unofficially raised full-year estimates in its second quarter reporting. The overall effect is still a decrease from the company’s original guidance. But, the bump now represents improvement over 2014 results which can be extrapolated into safety of the dividend and potential for share price improvement. Otter Tail’s first quarter results were mixed in its manufacturing segment, Varistar. The segment was unexpectedly tripped up by the downturn in the oil and gas industry. The second quarter performance still showed some impact but the company was better able to manage the challenges. The loss of sales to manufacturers of oil and gas equipment was partially offset by sales to manufacturers of lawn and garden equipment, recreational equipment and wind energy equipment. Year-over-year, the segment’s revenue in the quarter decreased 4%. On the bottom line, the segment’s operating income increased 8.6% year-over-year. The primary contributor to the difference was lower resin prices. Otter Tail sold more pounds of PVC pipe at lower prices but it cost the company much less to do so. Relative to its core business of being an electric utility, the company’s performance was favorable in the second quarter. The weather is, obviously, beyond the company’s control. To date, 2015 has offered milder seasons. In the 2014 second quarter, compared to “normal”, both the heating degree days and cooling degree days exceeded 100%. By comparison, in 2015, the heating degree days registered only 82.7% of normal and cooling degree days registered 78.9% of normal. Sales in the quarter were lower to both retail and wholesale customers. This loss was offset by ECR (environmental cost recovery) rider revenue related to the company’s ACQS (air quality control system) environmental upgrade project and higher transmission tariff revenue from MISO (Midcontinent Independent System Operator) related to increased investment in regional transmission lines. The slide below from the latest investor presentation depicts the regulated rate base capital expenditures for the next 5 years which will drive growth: (click to enlarge) Contributing directly to the segment’s bottom line, the company’s production fuel costs and maintenance expenses were lower in the quarter. Year-over-year, the segment’s operating income and net income increased over 50%. The second quarter delivered $0.36 in EPS from continuing operations, a 71% increase compared to the 2014 second quarter. Year-to-date, the EPS total of $0.73 is still lagging 2014 by 10%. In 2014, full-year EPS was $1.55. Otter Tail’s original guidance for 2015 was a range of $1.65 to $1.80. With the first quarter results, the range was adjusted to $1.50 to $1.65. In the second quarter press release, Otter Tail management stated it “now expects to be in the middle to upper end of the range”. The company did not formally adjust the range. But, the statement unofficially moves the guidance to $1.57 to $1.65. Based on the company’s strategy, the utility segment’s earnings are to support the dividend paid to shareholders. The 2015 EPS projection for the segment is $1.23 to $1.26. The company’s current annual dividend rate is $1.23. The Varistar segment’s earnings are intended to cover corporate costs and drive share price appreciation. The current full-year projection per share for this segment is $0.50 to $0.58. Corporate costs are projected in a range of $0.19 to $0.23 per share. Compared to 2014 where corporate costs totaled $0.22 per share for the full year, the company is currently operating at just 80% of the 2014 rate. An adjustment to full-year EPS warrants an adjustment in a buy point for Otter Tail. Using the unofficial full-year EPS range of $1.57 to $1.65 equates to a midpoint of $1.61. At a dividend rate of $1.23, the payout ratio based on the unofficial midpoint would be less than 80%. Acknowledging Otter Tail, at 4.4%, has consistently paid above the average yield for diversified utilities, any price up to $30.75 maintains a yield of 4%. As well, any price below $30.75 equates to a P/E ratio equal to the average P/E ratio of 19.09 for the Utilities sector. Disclosure: I am/we are long OTTR. (More…) I wrote this article myself, and it expresses my own opinions. I am not receiving compensation for it (other than from Seeking Alpha). I have no business relationship with any company whose stock is mentioned in this article. Additional disclosure: I belong to an investment club that owns shares in OTTR.
Alternate Current: The Power Of Diverse Return Sources

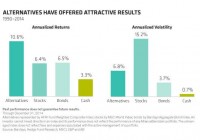
By Christine Johnson After a long period of calm, global markets now face tumbling oil prices, geopolitical risks and monetary policy changes. Investors looking for new ways to diversify in this uncertain environment should take a long look at investments that don’t take their cues from stock or bond market movements. The Key: Un-Stock-Like Return Patterns Alternative investments have that name for a reason: they don’t act like traditional investments. Adding alternatives thoughtfully to a portfolio may lower its sensitivity to the stock market and interest-rate fluctuations. Alternatives also have the potential to enhance long-term returns and reduce risk. Investors may be surprised to learn that over the last 25 years, alternatives have produced higher returns than stocks, bonds or cash – with less than half the volatility of stocks (Display). A big part of the equation? Managers’ use of flexible investment approaches, and their ability to act opportunistically to exploit mispricings within and across asset classes. How Do Alternatives Handle Stress? On average, alternative investments haven’t been up as much as stocks in bull markets, but they also haven’t been down as much as stocks in bear markets. By losing less than traditional equity strategies during times of market stress, alternative strategies have historically preserved investors’ capital. In 2001 and 2002, as markets struggled to recover from the dot-com bust, alternatives provided more downside protection than stocks. In 2008, alternatives also lost less than stocks. Alternatives in the Portfolio Context Investors want more diversification in their portfolios; we think investments that don’t track stock and bond markets as closely as traditional investments offer that potential. Many alternative strategies provide returns driven more by a manager’s skill in decision making than by broad market movements. And there’s a lot of variety among alternatives. Investors can choose narrowly-focused alternative strategies – nontraditional bond or long/short equity, for example. Or they can opt for a more diversified strategy like multi-manager. This offers exposure to diverse approaches – and even diverse managers. A manager’s investing skill is integral to alternative investing, and the returns of individual strategies can vary greatly. A diversified strategy may prove valuable. Challenging market periods turn up unexpectedly, and a diversified investing approach that incorporates alternatives may help portfolios’ performance across diverse market conditions. Not all strategies will be in or out of favor at a given time. This point is particularly relevant in terms of US stocks. The lofty returns of the last couple of years won’t last indefinitely – so it makes sense to look for strategies whose return patterns offer something different from those of the broad market. The views expressed herein do not constitute research, investment advice or trade recommendations and do not necessarily represent the views of all AB portfolio-management teams. MSCI makes no express or implied warranties or representations, and shall have no liability whatsoever with respect to any MSCI data contained herein. The MSCI data may not be further redistributed or used as a basis for other indices or any securities or financial products. This report is not approved, reviewed or produced by MSCI. Christine Johnson is Managing Director of Alternative Investments at AB (NYSE: AB ).

Alpha Generation For Active Managers

We are currently seeing a lot of attractive opportunities in the high-yield market. They don’t really seem to reflect the true opportunity we are seeing in the market. This is where active management is especially important. By: Heather Rupp, CFA, Director of Research for Peritus Asset Management, the sub-advisory firm of the AdvisorShares Peritus High Yield ETF (NYSEARCA: HYLD ) As we discussed in our recent blog (see ” The Opportunity in Volatility “), we are currently seeing a lot of attractive opportunities in the high-yield market discounts and yields that we haven’t seen in some time. And while we have seen the yields in the high-yield indexes and the products that track them increase over the last six months, they don’t really seem to reflect the true opportunity we are seeing in the market. For instance, the yield-to-worst on the Barclays High Yield index is 6.46% 1 , and many of the large index-based products are reporting yields around 6%. While this is certainly better than the index yields of sub-5% that we saw in mid-2014, this level at face value isn’t something we’d be really excited about. So then why are we excited about today’s high-yield market and see this as an attractive entry point? Digging into what is held in the index, we see 33% of the issuers in index trade at a yield-to-worst of 5% or under 2 . The large majority of this low-yielding contingency consists of quasi-investment grade bonds, rated Ba1 to Ba3. Not only does this group provide a low starting yield, but would expose investors to more interest rate sensitivity if and when we do eventually see rates rise (given the lower starting yields). On the flip side, 30% of the issuers in that index are trading at a yield-to-worst of 7.5% and above 2 , which in today’s low-yielding environment, with the 5-year Treasury around 1.2%, seems pretty decent. This group is certainly not dominated by the lowest rated of names, and within this group, we are seeing an eclectic mix of businesses and industries. Yes, there are segments of this group that we are not interested in. For instance, we have been outspoken on our concerns for many of the domestic shale producers in the energy space, given that we saw these as unsustainable business models when oil was near $100, and those issues will certainly be acerbated with oil at $50 as cash to mitigate the rapid well decline rates and to service heavy debt loads quickly runs out. But there are also what we see as great mix of business and industries that we would be interested in committing money to, especially at these levels. This is where active management is especially important. We view active management as about managing risk and finding value. Yes, it is about managing credit risk (determining the underlying credit fundamentals and prospects of each investment you make – basically doing the fundamental analysis to justify an investment in a given security) and managing call risk (paying attention to the price you are paying for a security relative to the next call price to address the issue of negative convexity), as we have written about at length before. Yet, one risk factor that is often overlooked is that of purchase price. By this, we mean buying at an attractive price. While it isn’t very intuitive, because it often seems that the risk is less when markets are on a roll and moving up, but really the lower the price you pay for a security, the lower the risk (you have less to lose because you put less in up front). Jumping in on the popular trade certainly doesn’t reduce your risk profile. Rather, you want to purchase a security for a price less than you think it is worth. As we look at much of the secondary high-yield market, especially many of the B and CCC names that have been out of favor over the past several months, we are seeing a more attractive buy-in for selective, active managers, which we believe lowers our risk. And there remains a segment of “high yield” that isn’t at prices or yields that we would consider attractive, and we will avoid investments in those securities. Alpha generation involves buying what we see as undervalued securities with the goal of generating excess yield and/or potential capital gains. Today, we are seeing this opportunity for potential alpha generation for active managers. 1 Barclays Capital US High Yield Index yield to worst as of 1/30/15. Formerly the Lehman Brothers US High Yield Index, this is an unmanaged index considered representative of the universe of US fixed rate, non-investment grade debt. 2 Based on our analysis of the Barclays Capital High Yield index constituents as of 1/30/15. Disclosure: The author has no positions in any stocks mentioned, and no plans to initiate any positions within the next 72 hours. (More…) Business relationship disclosure: AdvisorShares is an SEC registered RIA, which advises to actively managed exchange traded funds (Active ETFs). This article was written by Heather Rupp, CFA, Director of Research of Peritus, the portfolio manager of the AdvisorShares Peritus High Yield ETF (HYLD). We did not receive compensation for this article, and we have no business relationship with any company whose stock is mentioned in this article. This information should not be taken as a solicitation to buy or sell any securities, including AdvisorShares Active ETFs, this information is provided for educational purposes only. Additional disclosure: To the extent that this content includes references to securities, those references do not constitute an offer or solicitation to buy, sell or hold such security. AdvisorShares is a sponsor of actively managed exchange-traded funds (ETFs) and holds positions in all of its ETFs. This document should not be considered investment advice and the information contain within should not be relied upon in assessing whether or not to invest in any products mentioned. Investment in securities carries a high degree of risk which may result in investors losing all of their invested capital. Please keep in mind that a company’s past financial performance, including the performance of its share price, does not guarantee future results. To learn more about the risks with actively managed ETFs visit our website AdvisorShares.com .