Tag Archives: applicationtime

The New Enhanced Bond Rotation Strategy With Adaptive Bond Allocation

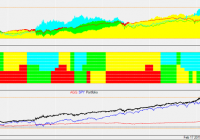
Summary A top 2 ETF (out of 4) bond rotation strategy with adaptive allocation. Switching between treasury bonds and corporate bonds depending to market conditions. Built to perform also in a rising rate environment. On November 2013 I published the first SA article on the BRS ( Bond Rotation Strategy ). Now, 15 months later, I am presenting an important update for this strategy. Even though the old strategy has done well, I think it is very important to constantly validate and improve any investment strategy. Markets change, ETFs change and even we ourselves grow and learn how to increase the returns and limit the risk of our own investments. In November 2014 I presented the Universal Investment Strategy which was based on a variable allocation of the SPDR S&P 500 Trust ETF ( SPY)- iShares 20+ Year Treasury Bond ETF (NYSEARCA: TLT ) funds. This new concept of an ETF rotation with variable allocation is very versatile and can be used on all types of strategies. For the BRS strategy, this new way to calculate allocations results in a considerably improved Sharpe (Return/Risk) ratio of the strategy. Here is the ETF selection for the BRS Old ETF selection New ETF selection SPDR Barclays Capital Convertible Bond ETF (NYSEARCA: CWB ) CWB SPDR Barclays Capital High Yield Bond ETF (NYSEARCA: JNK ) JNK iShares 10-20 Year Treasury Bond ETF (NYSEARCA: TLH ) TLT PowerShares Emerging Markets Sovereign Debt Portfolio ETF (NYSEARCA: PCY ) iShares Core Total U.S. Bond Market ETF (NYSEARCA: AGG ) not necessary anymore PIMCO Total Return ETF (NYSEARCA: BOND ) not necessary anymore iShares 1-3 Year Treasury Bond ETF (NYSEARCA: SHY ) not necessary anymore. The total allocation can go automatically below 100% An advantage of the adaptive allocation is, that we can work with less ETFs. We do not need the total return ETFs and anymore. The old BRS used these ETFs to achieve a blended way of investing in treasuries and corporate bond ETFs. This was needed because normal switching strategies don’t take into account cross-correlation between ETFs. I had to add total return ETFs so that the strategy ‘knew’ about the possible Sharpe ratio of a blended ETF. The new strategy, however, does calculate cross correlations and it will allocate automatically to the top ETFs, so that the Sharpe ratio is maximized. Cross correlation of ETFs is extremely important. If for example the stock market is doing well, then a normal ranking ETF strategy would probably invest in the two highly correlated corporate bonds: and. However a combination of with a negatively correlated treasury would probably have the better Sharpe ratio because of the inverse correlation of the two ETFs. This would reduce volatility and this would result in a higher Sharpe ratio for this ETF pair. For the selection of the 4 ETFs, it was very important to have uncorrelated bonds, so that we would have a successful ETF combinations for any kind of market. ETF Average correlation to the stock market CWB 0.8 JNK 0.7 PCY 0.25 TLT -0.5 (-0.75 during market corrections) PCY is an interesting addition with low correlation to the other ETFs. From a correlation point of view, it sits half-way between stocks and treasuries, and it gives the strategy some additional global diversification. To calculate the strategy we use our QuantTrader software. As this is a top 2 ETF strategy, the algorithm calculates the maximum Sharpe allocation for all 6 possible ETF pairs. We could run allocations from 0% to 100% for each ETF, but for the bond rotation it is better to limit the allocations from a 40% minimum allocation to a maximum of 60%. If we allow bigger variations the risk increases because there would be times where we are invested up to 100% in one single ETF. The return would also increase, but the Sharpe ratio would be lower than with this 40%-60% allocation. One way to further improve risk adjusted returns would be to always invest in all 4 ETFs with adaptive allocation. The algorithm would loop through all allocations like 10%-30%-20%-40% and calculate the max. Sharpe allocation considering the cross correlation of all 4 ETFs. For bigger investments, this would be the best solution with the highest Sharpe ratio and a very low volatility of only 5%. It is also good because the ETF risk is spread among 4 ETFs rather than 2 ETFs. However for the private investor an investment in the best 2 ETFs is absolutely sufficient. The new BRS strategy shares the same tweaked Sharpe formula with the UIS strategy. Normally the Sharpe ratio is calculated by Sharpe=rd/sd with rd=mean daily return and sd= standard deviation of daily returns . I don’t use the risk free rate, as I only use the Sharpe ratio to do the ranking. My algorithm uses the modified Sharpe formula Sharpe=rd/(sd^f) with f=volatility factor . The f factor allows me to change the importance of volatility. If f=0 , then sd^0=1 and the ranking algorithm will choose the composition with the highest performance without considering volatility. If f=1 , then I have the normal Sharpe formula. Using values of f> 1 , I rather want to find ETF combinations with low volatility. With high f values, the algorithm becomes a “minimum variance” or “minimum volatility” algorithm. Here is a comparison between different ways to execute the BRS Comparison of different BRS strategies (5 year) Strategy 5 year CAGR Sharpe ratio Max drawdown 1 Old BRS strategy (top 1 ETFs) 11% annual return 1.13 -12.2% 2 Old BRS strategy (top 2 ETFs) 12.5% annual return 1.44 -9.3% 3 New BRS strategy (2 ETFs) 17% annual return 2.25 -6.5% 4 New BRS strategy (4 ETFs) 13% annual return 2.45 -6.6% 5 benchmark: AGG 4.18% annual return 1.25 -5.1% 6 benchmark: SPY 15.9% annual return 1.01 -18.6% N.B. – no 3 is the strategy used by Logical-Invest The max. drawdown coincides with the end of QE announcement in 2013. Bond strategy drawdowns are mostly driven by FED announcements, but they are about 3x smaller than drawdowns. Here is a screenshot of the 5 year backtest of the new BRS with QuantTrader (click to enlarge) The middle graph shows the allocation of the ETFs and the lower graph shows the strategy compared to two benchmarks: AGG and SPY. Due to the limited history of CWB, which exists only since 2009, this backtest is quite short. However, using mutual fund proxies we can backtest the strategy using a longer historical period. There is a plenitude of different proxies using mutual funds, but none is a 100% match. In particular, emerging market bonds are only available in recent times. Still they add unique diversity. Long term backtests are interesting, but personally I don’t think that you need to look back longer than 10 years. Markets and ETFs evolve so quickly that history that extends back for more than 5 years, is not really useful in fine-tune a strategy which has to successfully trade in current market conditions and whose only goal is to predict the next 20 trading days. So take the results below with a grain of salt. They show that the fundamental principle of the strategy works even before 2008. It does perform even better after 2008 due to increased momentum of stock and bond markets after the 2008 correction. The most important lesson learned from this longer term backtest is that you don’t need to be afraid of big market corrections. Such corrections are even good for strategies with variable allocation, because you can make double the gains. Once using defensive Treasuries during the down going market and then a second time when the markets go up again. Mutual fund proxies used for the longer term backtest ETF Proxy TLT Vanguard Long-Term Treasury Fund Inv (MUTF: VUSTX ) JNK T. Rowe Price High-Yield Fund (MUTF: PRHYX ) PCY T. Rowe Price International Bond Fund (MUTF: RPIBX ) CWB Vanguard Convertible Securities Fund Inv (MUTF: VCVSX ) Benchmark: AGG Benchmark: Vanguard Total Bond Market Index Fund Inv (MUTF: VBMFX ) Here is a screenshot of the 13 year backtest of the mutual fund BRS with QuantTrader (click to enlarge) The charts show that the strategy worked well since 2002. CAGR is 13.2% and Sharpe is 2.02. The max. drawdown was 12.5% in 2008. However one last important question for the future is how the strategy will handle rising rates? I think that the BRS should still do quite well in a rising rate environment, because of the two corporate bonds funds, CWB and JNK. Long duration 15-18 year Treasury bonds and TLT will be affected most by rising rates. But even here I would set a question mark. With Treasury yields near zero in Europe, these U.S. long term bonds are still extremely attractive. Convertible corporate bonds or high yield bonds with short duration and a high coupon are even more attractive and should do quite well in a rising rate environment. Emerging-markets bonds like are quite susceptible to global sentiment, but they should be less affected by rising rates also because of their lower 9 year duration. All I know is, that the banks and Federal Reserve have been constantly wrong about their predictions on rising rates for five years, so be skeptical of any rate predictions. Better let algorithms decide how to change bond allocations. Disclosure: The author has no positions in any stocks mentioned, and no plans to initiate any positions within the next 72 hours. (More…) The author wrote this article themselves, and it expresses their own opinions. The author is not receiving compensation for it. The author has no business relationship with any company whose stock is mentioned in this article.
Cyber Security ETF Fired Up On Blowout Earnings

Cyber security – a need of the hour – has developed into a booming industry on growing awareness due to widespread hacking. With the extensive adoption of Internet usage in enterprises and government agencies, cyber attacks are increasingly difficult to prevent. But this evil of technology is in focus, and governments and businesses are willing to beef up their spending on information security. This young corner of the broad technology space represents one of the few growth opportunities left for developed market investors. Growth will likely come from the rapid adoption of mobile, cloud, social and information technologies. In fact, it seems that the cyber security trend has reached a new level this earnings season, as most of the companies in the space impressed with robust results. For investors seeking to play this trend in a basket form, there are a few options, PureFunds ISE Cyber Security ETF (NYSEARCA: HACK ) being the most notable. Buoyed by the solid earnings, this product has surged 12.5% over the past ten days and about 13% since its debut in November. It has gathered enough interest from investors, accumulating $261 million in AUM in just three months. Average daily volume is also solid as it exchanges around 282,000 shares in hand (read: Inside HACK: The Sought-After Cyber Security ETF ). Given this, it might be worth it to shed some light on this newly introduced ETF and its holdings for investors not familiar with it but thinking about jumping in on the space. Below we highlight some of the key details regarding HACK and how recent earnings have led to this fund’s solid run. HACK in Focus The fund offers exposure to the companies that ensure the safety of computer hardware, software, networks, and fight against any sort of cyber malpractice. It tracks the ISE Cyber Security Index, holding 30 securities in its basket. It is well spread out across components, as each security holds no more than 5.71% of total assets. From an industrial outlook, software and programming accounts for nearly two thirds of the portfolio while communication equipment and Internet mobile applications round off the top three. In terms of country exposure, U.S. firms take the top spot at 71%, followed by Israel (13%), the Netherlands (5%), South Korea (5%), Japan (4%), Finland (3%) and Canada (1%). Cyber Security Earnings in Focus The torrid run in HACK was driven by the stellar Q4 earnings and a bullish outlook on CyberArk Software (NASDAQ: CYBR ) and the subsequent surge in its stock price. CYBR shares soared as much as 40.7% to record high of $64.45 since its earnings announcement on February 12. The stock takes the top spot in the fund’s basket with 5.71% share (read: These New ETFs Could be Big Winners ). CyberArk reported earnings per share of 19 cents, outpacing the Zacks Consensus Estimate of a penny and saw nineteen-fold jump from the year-ago quarter. Revenues surged 81% year over year to $36.3 million and strongly surpassed our estimate of $27 million. The company projects earnings per share in the range of 4-6 cents on revenues of $25.5-$26.5 million for the ongoing first quarter. For 2015, revenues are expected to grow 23-26% to $127-$130 million and earnings per share are projected at 24-27 cents. The earnings guidance for both the quarter and the full year is much higher than the Zacks Consensus Estimate of a loss of 26 cents and earnings of one cent, respectively. The cyber security ETF’s second holding – FireEye (NASDAQ: FEYE ) comprising 5.55% share in the basket – also topped our estimates and guided higher. Net loss of 64 cents was narrower than our expected loss of 83 cents and revenues of $143 million exceeded our estimate of $141 million. FireEye expects revenues in the range of $118-$122 million for the ongoing first quarter and $605-$625 million for the full year. Net loss per share is projected at 49-53 cents for the first quarter and $1.80-$1.90 for the full year. The Zacks Consensus Estimate at the time of earnings release was pegged at a loss of 79 cents and $3.18 cents, respectively. FireEye has jumped over 24% to date post earnings announcement on February 11. Further, Qualys (NASDAQ: QLYS ) also contributed to the upside in HACK. The stock shot up as much as 21% and hit a new all-time high of $49.42 on upbeat earnings and robust guidance. The firm occupies the fourth position in the basket and represents about 4.57% of the fund (see: all the Technology ETFs here ). Earnings per share of 9 cents strongly outpaced the Zacks Consensus Estimate by 7 cents while revenues of $37 million also edged past our estimate of $36 million. For the first quarter, Qualys expects revenues of $37.6-$38.1 million and earnings per share in the range of 10-12 cents, which is much higher than the Zacks Consensus Estimate of 6 cents. It also projects 2015 revenues of $167.3-$169.3 million and earnings per share of 50-55 cents, well above our estimate of 34 cents. Juniper Networks Inc. (NYSE: JNPR ) also contributed to the rally in HACK as it is one of its top 10 holdings, accounting for 4.18% share. It beat on both the bottom and top lines by 9 cents and $0.033 billion, respectively. Further, the forward guidance for the first quarter is also encouraging. The company expects earnings per share in the range of 28-32 cents, the midpoint of which is higher than the Zacks Consensus Estimate of 18 cents at the time of the earnings release. Revenues are expected in the range of $1.02-$1.06 billion. Shares of JNPR rose nearly 9% since its earnings announcement on January 27. Apart from the incredible cyber security earnings, HACK also got a boost from Obama’s initiative taken at the first ever summit on Cybersecurity and Consumer Protection held last week. The president signed an executive order that focuses on consumer protection and private-public partnerships against cyber threats (read: Obama Budget Plan Drives Up These Sector ETFs ). Further, Russia’s Kaspersky Lab, a major cyber security firm, released data on the widespread breach in the financial sector early this week that raises concerns about cyber security, propelling the stocks and the ETF higher. The report showed that a group of hackers have stolen at least $1 billion from over 100 banks in 30 countries since late 2013. Bottom Line The cyber security ETF is showing relative strength and should continue to outperform the broad technology space in the coming months given the impressive earnings and solid guidance from many players. Further, the growing awareness for the protection against the cyber threats will likely take the space to new heights. So, for investors seeking to play the potential rise in cybercrime, HACK could be the ticket in 2015.

Bond Fund Choices For Retiree Portfolios

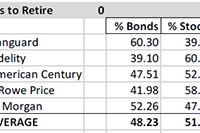
Summary Most retirees need/want some of their portfolio allocated to bond funds. For those with “about right” total assets for retirement, institutions recommend bond allocation of 40% to 60%. Numerous factors will tend to keep intermediate and long-term interest rates “lower for longer”. The middle of the bond yield curve is probably the best place to be. Corporate bonds and municipals make more sense than Treasuries for most individual accounts. Many retirees or near retirees need help deciding how to allocate between bonds and stocks, or how to prepare for a productive discussion about allocation and security selection with their advisor. This is intended to help those investors with the bond fund element of the decision. Fund Allocations: This table shows institutional recommendations for asset allocation for investors in the withdrawal stage of their financial lives, and with assets approximately sufficient for their needs (not great excess assets and not great deficiency – relative to lifestyle costs). Adjusting for Your Circumstances: According to the experts, retirees should be at or between these bond/stock allocation limits: 60/40 and 40/60. That allocation makes the global assumption that retiree assets are “just about right” – not way too little, or “way more than needed”. If assets are “way too little”, then retirement postponement, part-time work, and/or proportional reductions in standard of living is probably necessary; and the 60/40 to 40/60 allocation probably still makes sense. If assets are “way more than needed”, there are two reasonable alternatives to the 60/40 to 40/60 allocation. One alternative is to be more conservative, because the gradual loss of earning power in a heavy fixed income portfolio is seen as an acceptable trade-off to have a smoother ride. The other alternative is to be more aggressive – probably by investing “sufficient” assets in the 60/40 to 40/60 allocation, and then investing the balance in equities to grow the overall portfolio. Historical Results of 11 Bond/Stock Allocation Risk Levels: Using our 11 levels of allocation, experts recommend that you be in what we have labeled “Balanced-Conservative”, “Balanced Moderate” or “Balanced Aggressive”. This chart shows the 39-year historical returns for all 11 allocation levels, including mean return, best return and worst return, as well as the returns statistically expected at +/- 1, 2 and 3 standard deviations from the mean (roughly representing these probability ranges: 67%, 95% and 99.7%). This chart shows the returns of each allocation over multiple short and long-term periods. This chart shows the calendar year returns for 2008 through 2014 for each allocation. US Bond Funds Don’t Come In Just One Flavor, or Have One Outcome: Once you decide on the bond allocation level that makes sense, you might then want to consider what type, duration and quality of bonds to use. The allocation data above assumes aggregate US bonds (which has morphed over time as the relative level of government and corporate issuance changed, and as the relative levels of maturities have changed). You may wish to lock-in more predictably to a type or duration or quality for your portfolio, or to manage the mix as you see fit, instead of taking whatever the aggregate provides. You can do that with funds. Given that, let’s look at some of your choices: Corporate and Municipal Bonds Typically Best For Individuals: Corporate bonds or muni bonds are most likely to be suitable for you. Treasuries are generally best for tax-exempt investors (pensions, foundations, and foreign governments), while corporate and municipal bonds, with higher after tax returns are generally best for individuals. Corporate high yield did very well after the crash, but that party is over, and they have been faltering as of late, since the yield spread to Treasuries had reached a very low level. High-yield bonds have a high correlation with stocks and are not good counter cyclical diversifiers. Long-term corporates have done best as rates fell, and will continue to do well if interest rates decline, but will do poorly if rates increase. Short-term corporates have contributed least to return, and probably have more downside risk than normal, due to the Fed planning to exit QE by gradually raising short-term rates. Intermediate-term bonds are probably best bet. The muni charts are for nominal returns, which you have to gross up for your tax bracket. They have been more consistent in their returns, and their high-yield bonds have not suffered as corporate high yields have done – making them less correlated with stocks than high-yield corporate bonds. Yield, Duration and Quality Metrics for Bond Fund Types: Here are some metrics for the specific bond funds shown in the charts above. These two tables show yield, duration, quality, and quality composition of each representative fund. How Interest Rate Changes Impact Bond Prices: Here is how changes in interest rates impact bond values: Which Way Are Rates Likely to Go Near-Term? Some big names expect intermediate and long rates to decline, and short rates to rise, but not to historical “normal” levels. The inflation crowd expects rates to rise due to inflation. The anti-Fed crowd expected rates to rise when Fed bond buying ceased, but that did not happen. Most experts last year forecasted rising rates (I bit on that), but we were wrong. The “lower for longer” crowd (including Bill Gross, Jeff Gundlach and Robert Shiller) point out these factors: US Treasury rates are the highest among major developed market issuers – creating demand for our bonds, which raises prices and lowers yields. US currency is the strongest at this time among major currencies – creating demand for our bonds, which raises prices and lowers yields. Aging Baby Boomers, who have most of the money, are net savers (formerly net borrowers) reducing demand for loans, which tend to reduce bank offered rates, and they want to own bonds, raising prices and lowering yields. Aging Baby Boomers, are reaching for yield, and will rotate out of dividend stocks into bonds as rates rise, dampening rate increases. US corporations approach saturation debt, with lower net issuance, reducing supply vs. demand, which raises prices and reduces rates. Federal deficits are declining, which lowers Treasury issuance, reducing supply vs. demand, which raises prices and reduces rates. Municipal issuance is down, lowering supply vs. demand, raising prices and reducing rates. Why Foreign Money Will Flow to US Bonds: Here is data showing how much higher US rates are than German and Japanese rates, for example: Speculators, who believe the dollar will remain strong, can borrow in Germany or Japan in local currency, and use the money to buy US bonds and make a nice spread similar to the spread that banks make on their deposits. That increases Treasury prices and lowers yields. What Does The Treasury Yield Look Like Now? Here is where the US Treasury yield curve stands today (the black line). You can see that the yield on the long end of the curve has been declining, while the short end of the curve has been rising. Rates are far below the 2007 level (gray line), but are not expected to get back to that level any time soon. How Are The Pros Viewing The Path of Very Short-Term Rates? How far will the short end rise? Here is the Fed Funds futures curve, which forecasts a 1.9% short end 2 years from now. If the intermediate-term Treasuries stay as they are, the yield curve above would be flat, but that is some time away. It is unknown whether intermediate rates will rise to keep the curve steep or whether it will go flat. This forecast suggests that short-term bonds are probably not good opportunities. They do little good if rates stay the same, and they suffer if rates rise. Conclusion: Even for aggressive investors, some small allocation to bonds has historically improved total return and risk/reward. Knowing about the range of bond fund options, and how various bond allocations relate to your specific circumstances is an important step in setting up a retirement portfolio. There is a lot more to think about than what is presented in this short article, but for a huge number of retirees or near retirees, this is something they still have to get under their belt before they manage their own money, or prepare themselves for a productive discussion with their investment advisor. Disclosure: The author and clients have some of these funds in their portfolios in varying degrees based on individual specific circumstances. General Disclaimer: This article provides opinions and information, but does not contain recommendations or personal investment advice to any specific person for any particular purpose. Do your own research or obtain suitable personal advice. You are responsible for your own investment decisions. This article is presented subject to our full disclaimer found on the QVM site available here . Disclosure: The author has no positions in any stocks mentioned, and no plans to initiate any positions within the next 72 hours. (More…) The author wrote this article themselves, and it expresses their own opinions. The author is not receiving compensation for it (other than from Seeking Alpha). The author has no business relationship with any company whose stock is mentioned in this article. Additional disclosure: Disclosure: The author and clients have some of these funds in their portfolios in varying degrees based on individual specific circumstances.