Tag Archives: applicationtime

It Pays To Be Choosy In Emerging Markets

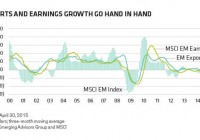
By Morgan C. Harting, CFA, CAIA Emerging equities remain rich in return opportunity, in our view. But as their recent whiplash behavior illustrates, capitalizing on this potential will require far greater selectivity than it did in the past. The recent selloff snapped a winning streak that had propelled the MSCI Emerging Markets Index up more than 11% through the end of April, far outpacing a flat S&P 500 performance. Still, the index remains well below its early 2011 levels, leaving most investors underweight and making this asset class one of the less crowded corners of the global equities market. In several countries, local investors have been buying stocks, pushing up market valuations and earning handsome returns – even though US$17 billion has been drained from emerging market equity funds so far this year. Worries about the US Federal Reserve’s impending first rate hike in a decade and a spike in currency volatility have dissuaded many foreign investors from taking broad emerging market exposure. Rallies in Russia and China Do domestic investors have an inside scoop on emerging market equities? Perhaps they’re less affected by country-specific concerns than foreign investors. For example, while foreign investors were worrying about the impact of sanctions on Russia, the local MICEX Index has marched higher; it’s now up more than 22% in US dollar terms this year. While global fund managers fixated on China’s slowing economic growth to a “mere” 6.5% and its corporate debt pileup, the Shanghai Composite Index surged 57%. Chinese retail investors have been opening up new brokerage accounts at a breakneck pace, encouraged by the government’s recent moves to boost economic growth and to open up its capital markets (including making it easier to use borrowed funds to buy stocks). Despite this local confidence, we don’t advocate a wholesale leap back into emerging markets. The powerful economic tailwinds of export growth, high commodity prices and domestic credit expansion that drove the asset class’s robust outperformance of the past decade have diminished. To find tomorrow’s winners, investors will need to make clearer distinctions among countries, companies and thematic opportunities. Exports Signal Caution A sharp focus on valuation and growth prospects remains central to our thinking about investments in emerging markets. One additional fundamental economic perspective that we believe is critical when considering the timing of allocations to emerging markets in portfolios is exports. Recent data from South Korea, which showed that exports declined by 10.9% year over year in May, as well as aggregate statistics over a longer time frame across a broader set of countries, simply don’t provide enough evidence of a broad resurgence in economic activity to justify an unconditional beta call today. It’s hard to find a metric tied as closely to emerging market equity returns – both fundamentally and empirically – as exports, in our view. When the US dollar value of exports from the developing world accelerates, positive operating leverage fuels even faster corporate profit growth and, in turn, stronger equity market returns. This is particularly true when valuations are as reasonable as they are today. Indeed, emerging market stocks are selling at 30% discounts to their developed market counterparts based on book value and 12-month forward earnings forecasts – among the largest in a decade. As the display below illustrates, the supercharged equity returns of the mid-2000s and 2010 coincided with very rapid export growth and even stronger earnings growth. But it also shows that there just hasn’t been much export growth in nearly four years, which largely explains why earnings growth and equity returns have disappointed. Why have exports been so weak? It’s not just lower commodity prices. We’ve also seen a sharp deceleration in demand for emerging market manufactured goods from developed countries, reflecting their lethargic economies (Display).  To our thinking, however, this symbiotic relationship is the most compelling counterargument to pessimists who say that the emerging market growth story is forever broken or that globalization is over. In our view, the developing equity markets remain a levered play on the developed world recovery. Emerging world corporations still enjoy robust operating profit leverage and global trade continues to expand. Eventually, we expect global economies to pick up, which should drive demand for goods produced in developing countries. Exports will then accelerate, driving even more powerful earnings growth. Good Reasons to Maintain Exposure Today, there’s still a case for keeping exposure to emerging countries. But, in our view, that exposure should be governed by fundamental, company and country-specific insights rather than as a broad market play. Wide price gaps across country markets can set up relative valuation plays – for example, Turkey is trading at 10 times forward earnings versus 25 times for Mexico. And there are pockets of opportunity across the emerging world, which aren’t as directly affected by macroeconomic trends, such as healthcare and private education in select markets. Of course, when hunting for idiosyncratic opportunities, it is important to weigh return potential against the higher volatility that typically accompanies emerging market stocks. Our bottom line: taking advantage of emerging market opportunities no longer comes down to a simple binary decision to raise or lower allocations. It requires deeper analysis and a selective eye. The views expressed herein do not constitute research, investment advice or trade recommendations and do not necessarily represent the views of all AB portfolio-management teams. MSCI makes no express or implied warranties or representations, and shall have no liability whatsoever with respect to any MSCI data contained herein. The MSCI data may not be further redistributed or used as a basis for other indices or any securities or financial products. This report is not approved, reviewed or produced by MSCI. Morgan C. Harting is the lead Portfolio Manager for all Multi-Asset Income strategies at AllianceBernstein.
Using Profitability As A Factor? Perhaps You Should Think Twice…

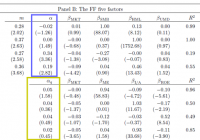
By Wesley R. Gray, Ph.D. Many investors are getting excited about the so-called ” profitability factor ,” originally posed by Novy-Marx (here is an alternative story ). Larry Swedroe has a high-level piece advocating the concept here . The basic idea is simple: Other things being equal, firms with high gross profits (revenue – costs) have earned higher expected returns than firms with low gross profits. Even market heavyweights Eugene Fama and Ken French have integrated the factor into their new ” 5-factor model ,” which consists of a market factor, size factor, value factor, profitability factor, and an investment factor. This research was not lost on Dimensional Fund Advisors (DFA), a massive quantitative asset manager that is essentially an extension of University of Chicago Finance Department. DFA has added the concept of profitability to their process (we assume it is the profitability factor identified by Fama and French). In the words of Eduardo Repetto, DFA’s CIO, regarding profitability: New research has to be very robust, very reliable and have real information that’s not already captured in the other dimensions. But how robust is the so-called profitability factor? Is it possible that the profitability factor might already be captured in other dimensions? A new paper entitled, “A Comparison of New Factor Models,” by Kewei Hou, Chen Xue, and Lu Zhang, shows that the profitability factor is not, in fact, a new “dimension,” as has been suggested. The authors find that the profitability factor highlighted by Fama and French is captured in cleaner ways by their simpler and more robust 4-factor model, which consists of a market factor, a size factor, an investment factor, and a return-on-equity factor. The authors highlight that there are “four concerns with the motivation of the Fama and French model based on valuation theory,” suggesting that the factors chosen by Fama and French are merely descriptive and/or data-mined, but not grounded in economic theory. Ouch. But the critique of the 5-factor model isn’t only on theoretical grounds, it is also based on the evidence. The Hou, Xue, and Zhang 4-factor model captures all the returns associated with the new factors outlined by Fama and French. Note the alpha estimates below. The yellow box highlights the alphas associated with the FF factors, controlling for the Hou, Xue, and Zhang factors, and the blue box highlights the alphas associated with the Hou, Xue, and Zhang factors, controlling for the FF factors. The Hou, Xue, and Zhang factors can explain the FF factors, but the FF factors cannot explain the Hou, Xue, and Zhang factors. This suggests that the “new” profitability factor may not be a new dimension at all, since it can be explained via exposures to the market, size, and Hou, Xue, and Zhang’s investment and ROE factors. (click to enlarge) The results are hypothetical results and are NOT an indicator of future results and do NOT represent returns that any investor actually attained. Indexes are unmanaged, do not reflect management or trading fees, and one cannot invest directly in an index. Additional information regarding the construction of these results is available upon request. Profitability is also questionable in international markets. In a working paper, ” The Five-Factor Fama-French Model: International Evidence ,” by Nusret Cakici, the author looks at the performance of the five-factor model in 23 developed stock markets. There is only marginal evidence the factor works globally. In some markets, the factor is effective, but in other regions such as Japan and Asia-Pacific, the factor simply doesn’t explain returns. Our own internal research on the matter is consistent with this result. Concluding remarks regarding the profitability factor A lack of unified results often hints towards a lack of robustness and/or data-mining. Only time will tell if the out-of-sample performance of the so-called profitability factor will hold. There are certainly a lot of smart academics and investment houses leveraging the factor as a way to capture higher returns, so we can’t rule anything out. However, our advice is to tread lightly in the factor jungle, being sure to always carry a heavy machete to chop away at noisy data and the overfitting problems that accompany them. Original Post

Bank ETFs Hitting Multi-Year Highs As Rates Hike Nears

The financial sector has clearly emerged out of the worst recession seen in 2008 and is showing strong momentum over the past one year, thanks to improving fundamentals and positive sentiment across banks. A healthy job market, growing manufacturing and service sectors, renewed housing recovery, and rising consumer confidence are leading to higher demand for all types of financial services, spreading optimism into the whole sector. In particular, banking corner of the space has been leading the way in recent sessions with most of the stocks and ETFs logging impressive gains. The robust performance came from speculations of interest rates hike in the U.S. that now looks much closer (as early as September), given robust job numbers and modest inflation. A rising interest rate scenario would be highly profitable for the banks, whose profits have been crimped by a shrinking interest rate spread following nearly six years of ultra-low rates. This is because banks seek to borrow money at short-term rates and lend at long-term rates. Now, with the rise in interest rates, banks would be able to earn more on lending and pay less on deposits. This would expand net margins and bolster banks’ profits. Further, U.S. banks now have much stronger balance sheets, and their quality of earnings is improving on a step-up in the economy. Added to the strength is solid loan growth, higher trading income, rising credit quality and litigation settlements. As the banks’ loan portfolio gains health, they will need less loan loss reserves in the future pointing to gainful trading for banking stocks and ETFs ahead. Moreover, the upside in this corner of the space could be confirmed by the Zacks Industry Rank, as five out of six banking industries actually have a solid Rank in the top 44% at the time of writing. Given this, bank ETFs have been grabbing investors’ interest lately and are hitting new multi-year highs in recent trading sessions. Any of the following funds could be solid picks for investors to ride out the surge resulting from higher rates: SPDR S&P Bank ETF (NYSEARCA: KBE ) This fund tracks the S&P Banks Select Industry Index and has an AUM of $2.8 billion. Volume is good as it exchanges more than 1.4 million shares a day while the expense ratio is at 0.35%. The product holds a diversified basket of 65 stocks with none holding more than 1.84% of total assets. It is slightly tilted toward small caps with more than half of the portfolio while the rest is split between the other two cap levels. From a sector look, more than three-fourths of the portfolio is allotted to regional banks while diversified banks, thrifts & mortgage finance, asset management & custody banks and other diversified financial services take the remainder. KBE hit a new high of $36.47 per share in nearly six years, representing a gain of about 10.3% in the past one-year timeframe. PowerShares KBW Bank Portfolio (NYSEARCA: KBWB ) This fund provides exposure to 24 stocks by tracking the KBW Bank Index. It is concentrated on the top four firms that make up for at least 8% share each. Though banks account for 88% share, consumer finance and investment companies also take minor allocations in the basket. Here, the fund focuses on large caps at 69% followed by mid-caps. The fund has amassed $351.9 million and trades in good volume of 126,000 shares per day on average. Expense ratio came in at 0.35%. The ETF hit a multi-year high of $40.34 per share, and has moved higher by about 11% in the past one year. SPDR S&P Regional Banking ETF (NYSEARCA: KRE ) This is one of the largest and the most popular ETFs in the banking space with AUM of nearly $2.2 billion and average daily volume of around 4 million shares. The product follows the S&P Regional Banks Select Industry Index, charging investors 35 basis points a year in fees. Holding 91 securities in its basket, the fund is widely spread out across each security with an equal-weighted approach. Small caps dominate the fund’s return at 76%, followed by mid caps (16%) and large caps (7%). The fund hit a new high of $44.30 since September 2008 and is up about 11% over the trailing one-year period. PowerShares KBW Regional Banking Portfolio (NYSEARCA: KBWR ) This fund follows the KBW Regional Banking Index, holding 50 stocks in its basket with none holding more than 4.06% share. It is a small cap centric fund as these account for 85% of the portfolio, while the rest goes to mid caps. The ETF is often overlooked by investors as depicted by its AUM of $34.3 million and average daily volume of under 4,000 shares. It charges 35 bps in fees per year from investors and hit a multi-year high of $43.71 per share, representing a gain of about 14% in the same period. iShares U.S. Regional Banks ETF (NYSEARCA: IAT ) This ETF offers exposure to 53 regional bank stocks by tracking the Dow Jones U.S. Select Regional Banks Index. Large caps dominate more than half of the portfolio with U.S. Bancorp (NYSE: USB ) and PNC Financial Services (NYSE: PNC ) taking the largest share with a combined 31% of assets. Other firms hold no more than 7.05% share. The fund has amassed $590.1 million in its asset base while sees good volume of 162,000 shares a day. It charges 43 bps in annual fees and surged 8.5% over the past one year to touch a multi-year high of $37.14 per share. Original Post