Tag Archives: applicationtime

Portfolio Report Card: A $1.23 Million Portfolio Built On The Wrong Foundation

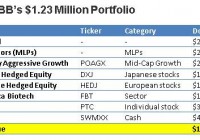
By Ronald Delegge From an observer’s viewpoint, the individual with a good sized investment portfolio (say above $1 million) doesn’t have much to worry about. They’ve got lots of money and that’s all that matters. Unfortunately, this misinformed view isn’t just dead wrong, but it incorrectly presumes the person with a large portfolio has done everything right. Is it true? First, let’s be explicitly clear: Being a good accumulator doesn’t automatically make a person a good investor. And based upon what I’ve seen, the number of good savers easily outnumbers the quantity of good investors. In other words, having a large investment portfolio is a wonderful convenience, but it doesn’t necessarily mean that your investments are correctly invested or properly aligned. My latest Portfolio Report Card is for BB, a late 60s retiree living in Naples, FL. He manages his own investments and told me he watches his money “like a hawk.” BB’s $1,236,939 million portfolio consists of a taxable brokerage account that contains one hedge fund, one mutual fund, one individual stock, three ETFs, a managed portfolio of energy master limited partnerships (MLPs), and some cash. BB asked me to do a Portfolio Report Card analysis to find out the strengths and weaknesses of his investments. What kind of grade does BB’s portfolio get? Let’s analyze and grade it together. Cost Investing is not a cost-free activity and your net performance is directly tied to how well or poorly you contain the cost of your investment portfolio. Sadly, most people are so distracted that minimizing trading activity, cutting fund expenses, and reducing other unnecessary fees isn’t a priority. BB’s portfolio owns one hedge fund, one separately managed account, one mutual fund, three ETFs, one individual stock, and cash. The mutual fund and ETF holdings have asset weighted expenses of 0.57% while the separately managed MLP account charges 1%. The cost of this portfolio is 65% more expensive compared to our ETF benchmark. Put another way, BB has too much fat in his portfolio. Diversification The hallmark of genuinely diversified investment portfolios is broad market exposure to the five major asset classes: Stocks, bonds, commodities, real estate, and cash. How does BB’s portfolio do? His portfolio has exposure to U.S. and international stocks, energy MLPs and cash. However, the portfolio lacks broad diversification to stocks because the funds he owns like the First Trust NYSE Arca Biotechnology Index ETF (NYSEARCA: FBT ) are sector focused. Likewise, the other funds he owns like the WisdomTree Japan Hedged Equity ETF (NYSEARCA: DXJ ) and the WisdomTree Europe Hedged Equity ETF (NYSEARCA: HEDJ ) engage in tactical strategies that concentrate exposure in a certain segment of the stock market. The same is true of his PRIMECAP Odyssey Aggressive Growth Fund (MUTF: POAGX ), which only owns a narrow segment of the stock market, mid-cap growth stocks. Although BB owns energy MLPs, this only covers one narrow segment of the entire commodities market. In summary, BB’s portfolio comes up short on diversification because of its highly concentrated, plus it lacks broad exposure to three major asset classes: real estate, commodities, and bonds. Risk Your portfolio’s risk character should always be 100% compatible with your capacity for risk and volatility along with your financial circumstances, liquidity requirements, and your age. BB’s overall asset mix of this total portfolio is the following: 76% stocks, 20% energy MLPs and 4% cash. Clearly, BB’s exposure to equities is elevated for his age group and doesn’t leave him much cushion if market conditions suddenly change. Although BB is financially versed, his risk management techniques could use an overhaul. Put another way, a 20% to 40% stock market decline would expose BB’s portfolio to potential market losses of $188,000 to $375,000. Tax Efficiency Smartly designed investment portfolios are always aggressive at reducing the threat of taxes. This can be achieved by owning tax-efficient investment vehicles like index funds or ETFs along with using smart asset location strategies. BB told me he’s been using tax losses carried over from previous years to offset his current portfolio’s tax liabilities. While this is good, the tax efficiency of BB’s portfolio can still be better. For example, the energy MLPs are not a tax-efficient asset yet they’re held in a taxable investment account. Performance Your portfolio’s performance is indeed the bottom line, but it’s never the only line. That’s because your performance return – good or bad – is directly impacted by your portfolio’s cost, risk, diversification, and taxes. How does BB’s portfolio do? This portfolio gained $27,000 (BB withdrew $60,000) and its one-year performance return from JAN 2014-JAN 2015 was (7.12%) vs. a gain of +3.77% gain for the index benchmark matching this same asset mix. Investment performance should match or exceed the benchmark and BB’s one-year performance is satisfactory. The Final Grade BB’s final grade is “C” (weak). Although BB’s one-year performance return was satisfactory, his performance is largely attributable to lots of luck along with a cooperative stock market versus financial acumen. Furthermore, it’s highly doubtful that BB’s equity heavy portfolio would deliver satisfactory performance in a different market climate. BB’s portfolio scored poorly at minimizing cost, maximizing diversification, and having a risk profile that is age-appropriate. Fixing these portfolio defects should be his priority. I’m especially concerned that BB has made non-core assets like hedge funds, sector ETFs, and tactically niche equity funds core components within his portfolio. This is a fundamental error. Substituting highly concentrated or leveraged non-core assets in the place of broadly diversified core assets inside your core portfolio is comparable to building a home on unstable terrain. In summary, if BB fixes the weaknesses within his portfolio, I believe satisfactory performance returns should become a regular thing versus a one-year anomaly. Ron DeLegge is the Founder and Chief Portfolio Strategist at ETFguide. Ron’s Portfolio Report Card grading system has been used to evaluate more than $100 million in portfolios and helps people to identify the strengths and weaknesses of their investment account, IRA, and 401(k) plan. Disclosure: No positions unless otherwise indicated Link to the original post on ETFguide.com
Leveraged Homebuilding ETFs Planned By Direxion

Direxion is a renowned player in the leveraged and inverse leveraged ETF world, alone possessing a major share of this segment of the investing corner. The issuer is in no mood to let go off its strong status as it recently filed up for two leveraged homebuilding ETFs – one regular, another inverse. Let’s take a look at the newly filed products. The Proposed ETFs in Focus Direxion Daily Homebuilders Bull 2X Shares ETF has been designed to replicate double the daily performance of the S&P Homebuilders Select Industry Index while Direxion Daily Homebuilders Bear 2X Shares ETF does exactly the opposite. This leveraged bear ETF gives the double inverse daily performance of the same index. The bull and bear ETFs charge 1.04% and 0.95% in expense ratio, respectively. The index follows the performance of a basket of 35 homebuilding companies. The index is not heavily concentrated on the top 10 holdings as it puts just 34% of assets in the portfolio. No stock accounts for more than 3.8% of the total. How Do These Fit in a Portfolio? These ETFs could be intriguing choices for those looking for a targeted exposure to the U.S. homebuilding sector. The homebuilding space has been performing well in recent times on sustained economic recovery despite a soft start to the year, a healing job market, moderating home prices and, certainly, low interest rates long prevailing in the country. As long as these economic attributes remain in place, homebuilding stocks should see a smooth journey. However, investors should not forget that the Fed is on the verge of policy tightening this year. Since homebuilding is an interest rate sensitive sector, it might be in disarray post Fed rate hike. Investors can play the pullback via the bear ETF then. Competition As of now, only five ETFs have true focus on the homebuilding sector. Among these, four are regular ETFs. Only one ETF, the ETRACS Monthly Reset 2xLeveraged ISE Exclusively Homebuilders ETN (NYSEARCA: HOML ) might pose as a threat to Direxion’s proposed leveraged bull ETF, if the latter gets an approval. Moreover, the expense ratio of the proposed ETF is higher than HOML which charges 85 bps in fees. The difference between daily (in the case of the proposed ETF) and monthly resetting technique (for HOML) might have caused this disparity in expense ratio. However, the coast is clear for the leveraged bear ETF as no such fund has hit the space as yet. Link to the original post on Zacks.com

RPG Is A Solid Growth ETF That Thoroughly Outperformed SPY Over The Last 9 Years

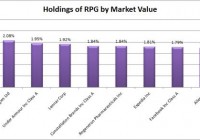
Summary The ETF looked solid all around. The standard deviation is a bit high relative to SPY, but that should be expected for tracking a smaller portion of the index. The strong liquidity may reflect many investors coming to the same conclusion about the ETF. It looks worthy of deeper consideration. Diversification within the ETF is solid, but investors should be aware that the portfolio turnover is very high. Investors should be seeking to improve their risk-adjusted returns. I’m a big fan of using ETFs to achieve the risk-adjusted returns relative to the portfolios that a normal investor can generate for themselves after trading costs. A substantial portion of my analysis will use modern portfolio theory, so my goal is to find ways to minimize costs while achieving diversification to reduce my risk level. In this article, I’m reviewing the Guggenheim S&P 500 ® Pure Growth ETF (NYSEARCA: RPG ). What does RPG do? RPG attempts to track the investment results of S&P 500 ® Pure Growth Index. The ETF falls under the category of “Large Growth”. Standard deviation of monthly returns (dividend adjusted, measured since April 2006) The standard deviation isn’t going to make a strong case for investing in RPG. For the period I’ve chosen, the standard deviation of monthly returns was 5.210%. For SPY, it was 4.416% over the same period. The higher level of volatility for RPG is a challenge since the correlation between the two funds is 94.87%. Yield & Taxes The distribution yield is .69%. I prefer higher yields so that they are more appealing for retiring investor portfolios. Sure, they could sell shares to generate income, but that may create a temptation to change the portfolio strategy at the wrong time. Expense Ratio The ETF is posting a gross expense ratio of .35% and a net expense ratio of .35%. Unfortunately, most ETFs have expense ratios higher than I’d like to see. This is another case where I prefer lower, but it isn’t going to be high enough to make me eliminate an ETF that otherwise has a fairly strong performance. The expense ratio for RPG isn’t all profit to the manager of the fund either. The fund should be incurring substantially more costs than a passive index fund because the portfolio turnover has been running at 46%. The holdings of RPG one year may be very dramatically different than the holdings in the following year. For comparison, only 19.2% of the portfolio value is in the top 10 holdings. The fund could completely exit those positions twice per year and still have a lower portfolio turnover. Market to NAV The ETF is trading at a .06% premium to NAV currently. I think any ETF is significantly less attractive when it trades above NAV and more attractive below NAV. A .06% premium is not enough to matter though. Investors should check prior to placing an order, but the liquidity in RPG should be a great hedge against any meaningful premiums or discounts. Liquidity The liquidity is excellent. I see no concerns. Average volume has been around 100,000 shares per day with share prices around $82 per share. That’s over $8 million changing hands each day. Largest Holdings The diversification within the ETF is pretty solid. Where else will you find an ETF that includes Apple (NASDAQ: AAPL ) but only has it in 10th place for weighting? (click to enlarge) Conclusion This is another Guggenheim ETF worthy of consideration. While I’d like to see lower expense ratios, I find them reasonable for the level of turnover in the holdings. On an economic level, I find it doubtful that investors will produce alpha over the long term through frequent trading when accounting for the costs of that trading. On the other hand, RPG is precisely the fund to contract me on that. Just look at the returns on the fund and you’ll see what I mean: (click to enlarge) RPG thoroughly outperformed SPY over the sample period. I’ve included comparisons that use RPG for smaller portions of the portfolio since I think few investors would decide to invest their entire portfolio into RPG. The correlation is fairly high, but it is also expected since the ETF is tracking part of the same index. The standard deviation of returns is fairly high relative to SPY, but can be tolerated if expected returns are higher. Since the ETF is on the Schwab One Source list, regular rebalancing is definitely an option for funds with strong liquidity. All around, this appears to be a solid ETF for investors that are willing to accept additional volatility and believe that the regular trading can lead to higher risk-adjusted returns. Disclosure: The author has no positions in any stocks mentioned, and no plans to initiate any positions within the next 72 hours. (More…) The author wrote this article themselves, and it expresses their own opinions. The author is not receiving compensation for it (other than from Seeking Alpha). The author has no business relationship with any company whose stock is mentioned in this article. Additional disclosure: Information in this article represents the opinion of the analyst. All statements are represented as opinions, rather than facts, and should not be construed as advice to buy or sell a security. Ratings of “outperform” and “underperform” reflect the analyst’s estimation of a divergence between the market value for a security and the price that would be appropriate given the potential for risks and returns relative to other securities. The analyst does not know your particular objectives for returns or constraints upon investing. All investors are encouraged to do their own research before making any investment decision. Information is regularly obtained from Yahoo Finance, Google Finance, and SEC Database. If Yahoo, Google, or the SEC database contained faulty or old information it could be incorporated into my analysis.