Tag Archives: applicationtime

You Can Afford To Hold Cash

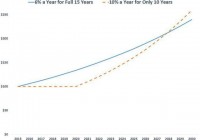
In my last post, I said stocks were too expensive. Instead of putting more of your money into diversified groups of stocks, you should just let cash build up in your brokerage account. A lot of people have a fear that those lost years of making zero percent on their idle cash can never be made up for. I’ve created a graph to show how much ground you’d have to make up. (click to enlarge) Let’s say you have two choices. One is to invest in an overpriced basket of stocks today and hold that basket from 2015 through 2030. This choice will compound your 2015 money at a rate of 6% a year. The second choice is to do nothing for all of 2015, 2016, 2017, 2018, and 2019. You just hold cash. That cash earns 0% for those 5 years. In 2020, you finally get an opportunity to make an investment that will return 10% a year from 2020 through 2030. If your investment horizon extends all the way out from today through 2030, the second approach overtakes the first approach about 15 years from now. Doing nothing for 5 years and then something smart for 10 years is a better 15-plus year strategy than “just doing anything” today. Here, we define something smart as 10% a year and “just doing anything” as 6% a year. You can decide for yourself whether your something smart is 10% a year or not. That’s subjective. What the “doing anything” returns is a lot more objective. So, let’s talk about that. Over the last 15 years, the S&P 500 (NYSEARCA: SPY ) returned about 5% a year. During that time period, the Shiller P/E ratio contracted from 43 to 27. The same percentage contraction – 37% – would be required to get the Shiller P/E down from today’s 27 to a historically “normal” 17. I see no reason why the S&P 500 should do better from 2015 to 2030 than it did from 2000 to 2015. That means I see no reason why buying the S&P 500 today and holding it through 2030 should be expected to return more than about 5% a year. (Almost all readers I talk to have a total return expectation for the S&P 500 that is greater than 5%, even for periods shorter than 15 years.) It’s also worth mentioning that while I have no predictions as to when idle cash would earn more than zero percent, the Fed does. And those predictions show cash earning a few percent in 2018 and 2019, instead of zero percent. For those reasons, the graph in this post is probably an underestimation of how quickly sitting and doing nothing till you can do something smart outperforms continuing to shovel cash into the S&P 500 at today’s prices. I think the reason people don’t feel secure in waiting for an opportunity to do something smart is that they’re not sure when that opportunity will appear. Maybe there will be no chance in all of 2015, 2016, 2017, 2018, 2019, 2020, or even 2021 to do something smart. If that’s true, isn’t it possible doing anything now could outperform waiting to do something smart later? If that later is sometime after 2021, couldn’t it be better to just buy the index today? Yes. I can only point to history. Pick any year in the past. Then move forward 6 years from that time. In the intervening years, was there an opportunity to do something smart? The hardest waiting period in history was during much of 1995 through 2007. Although stocks were often cheaper than they are today, the largest and best-known American stocks were almost always more expensive than they had been at any time before 1995. I think this is the real reason why investors I talk to are hesitant to hold cash. Much of their investing lifetime was spent during a time of high stock prices. There is no advantage in buying something that is unlikely to provide a good long-term return instead of holding cash till something good comes along. If we take 15 years as long term, we can say that the S&P 500 will not provide good long-term returns if bought today. You can afford to avoid 5%-a-year type long-term commitments if you have a real chance at finding 10%-a-year type long-term commitments sometime in the next 5 years. You don’t need to know exactly when or where this opportunity will come. A lot of investors who live outside the U.S. read this blog. They have an advantage. Their home countries’ stock markets might provide a 10%-a-year opportunity sometime in the next 5 years. American investors probably won’t notice such an opportunity when it appears. By buying into an index today, you are really saying you will just take whatever price Mr. Market gives you. You do this because you’re not sure he will ever give you a good price again. Or, if he does, it may come far more than 5 years in the future. Caving into Mr. Market’s mood is not something value investors think is appropriate when it comes to individual stock purchases. Yet, a lot of the people who read this blog – who are otherwise value investors – feel they have no choice but to continuously add to the actively and passively managed mutual funds in their brokerage account. The other choice is to hold cash. And the longer “long term” is for you, the more sense holding cash makes. It makes a lot of sense right now.
Investors Bulk Up On Bank ETFs And Options

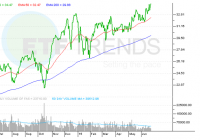
Summary The markets anticipate the Federal Reserve will hike interest rates some time this year. Financial sector ETFs could outperform in a rising rate environment. More investors are shifting money into financial sector ETFs. By Todd Shriber & Tom Lydon Concerns that the Federal Reserve is close to raising interest rates are of no concern at all for investors in financial services exchange traded funds, one of the most prolific asset-gathering corners of the ETF space in recent months. Rising Treasury yields have been a driving force behind financial services sector ebullience. Put simply, interest rates play a significant role in investors’ attitude toward bank stocks and ETFs. Investors are responding by pouring into ETFs such as the Financial Select Sector SPDR ETF (NYSEARCA: XLF ) and the corresponding bullish options. “For every 100 bullish contracts on the Financial Select Sector SPDR Fund, 112 puts were outstanding. That’s near the highest ratio since 2012, data compiled by Bloomberg show. Options protecting against a 10 percent drop in the ETF cost 6.16 points more than calls betting on a 10 percent rise, three-month data show. The spread, known as skew, reached 5.07 on June 16, the lowest since July,” reports Lu Wang for Bloomberg . XLF, the largest financial services ETF, has hauled in $811.5 million in new assets this month, after adding nearly $545 million in new assets last month. Inflows to financial services ETFs, including XLF, arrived after professional investors shunned the sector in the first quarter . The May flows to bank ETFs are interesting when accounting for seasonal trends, which highlight June weakness for the financial services sector. On a historical basis, XLF is the worst of the nine SPDRs in the sixth months of the year. Wells Fargo (NYSE: WFC ), Warren Buffett’s Berkshire Hathaway (NYSE: BRK.B ) and Dow component JPMorgan Chase (NYSE: JPM ) combine for over a quarter of XLF’s weight. “The Fed will raise rates for the first time since 2006 in September and lift them to at least 1.5 percent next year, according to the median forecast of more than 50 economists in a Bloomberg survey,” according to the news agency. Although money has been piling into ETFs like XLF in recent months, investors have taken a more muted approach to leveraged equivalents. For example, the ProShares Ultra Financials ETF (NYSEARCA: UYG ) , the double-leveraged answer to the iShares U.S. Financial Services ETF (NYSEARCA: IYG ) , has not added any new money this month. The Direxion Russel 1000 Financials Bullish 3X ETF (FAS ) , which attempts to deliver triple the daily returns of the Russell 1000 Financial Services Index, has added over $8 million this month. FAS and UYG are up 4.5% and 3.3%, respectively, over the past month. Direxion Russel 1000 Financials Bullish 3X ETF (click to enlarge) Disclosure: I/we have no positions in any stocks mentioned, and no plans to initiate any positions within the next 72 hours. (More…) I wrote this article myself, and it expresses my own opinions. I am not receiving compensation for it. I have no business relationship with any company whose stock is mentioned in this article.

M&A Activity Stokes Inflows To Healthcare Providers ETFs

Summary Increased industry consolidation could help support healthcare provider ETFs. Healthcare services ETFs attracting greater investment demand. The healthcare sector is booming on a wave of new clients as more enroll into the ACA. By Todd Shriber & Tom Lydon Buoyed by rumors that the health insurance industry is poised for consolidation on a grand scale, the iShares U.S. Healthcare Providers ETF (NYSEARCA: IHF ) has been steadily rising and raking in new assets. As of June 23, IHF added $247 million in new assets this year, the ETF’s biggest first-half inflows since it came to market in 2006, reports Joseph Ciolli for Bloomberg . Up 19.4% year-to-date, it is now home to $987.4 million in assets under management. For weeks, investors and the financial media have been expecting a wave of consolidation that could see marriages among some of IHF’s largest holdings. Earlier this week, Cigna (NYSE: CI ) rejected a $47 billion takeover offer from Anthem (NYSE: ANTM ). Anthem and Cigna are IHF’s fourth- and fifth-largest holdings, respectively, combining for over 13% of the ETF’s weight. Dow component UnitedHealth (NYSE: UNH ) has made overtures for rival Aetna (NYSE: AET ) while Aetna has been reportedly eying Humana (NYSE: HUM ), according to the Wall Street Journal . UnitedHealth, Aetna and Humana combine for about 23% of IHF’s weight. “Fueling the potential consolidation is the Obama administration’s 2010 health law, which put tougher rules on the industry, demanding more covered services, better care and a ceiling on profits. Companies are racing to capture the more than 20 million customers who will buy coverage under the law,” according to Bloomberg. Inflows to IHF are accelerating, including $138.1 million in the current quarter. In March 2014, the ETF had just $400 million in assets under management. Investors are also taking note of IHF’s equal-weight rival, the SPDR S&P Health Care Services ETF (NYSEARCA: XHS ) . XHS now has nearly $191 million in assets, $25 million of which have arrived this quarter. The ETF has added $54.1 million in new assets this year. Cigna, Aetna, Anthem, UnitedHealth and Humana combine for 10% of XHS’s weight. The ETF is up 15.8% this year. IHF and XHS are not strangers to healthcare mergers and acquisitions. Earlier this year, UnitedHealth agreed to acquire Catamaran (NASDAQ: CTRX ) for $12.8 billion in cash. In 2009, Express Scripts (NASDAQ: ESRX ) spent $4.7 billion to acquire WellPoint and followed up that deal with the $29 billion acquisition of Medco in 2012. Last month, shares of Quest Diagnostics (NYSE: DGX ), the provider of healthcare diagnostic testing services, after it was rumored that company could be a takeover target as well though chatter to that effect has since ebbed. Quest Diagnostics is 2.6% of IHF and 2% of XHS. iShares U.S. Healthcare Providers ETF (click to enlarge) Disclosure: I/we have no positions in any stocks mentioned, and no plans to initiate any positions within the next 72 hours. (More…) I wrote this article myself, and it expresses my own opinions. I am not receiving compensation for it. I have no business relationship with any company whose stock is mentioned in this article.