Tag Archives: applicationtime

5 Stocks Leading XBI Biotech ETF Higher

The biotech corner of the health care space is having a stellar run like last year and still remains a favorite investment destination for investors. This is primarily thanks to strong earnings growth, merger & acquisition frenzy, promising drug launches, cost-cutting efforts, a rise in the aging population, insatiable demand for new drugs, ever-increasing health care spending, expansion into emerging markets and the Affordable Care Act or Obamacare. Further, biotech stocks provide a defensive tilt to the portfolio amid political or economic turmoil. While most of the biotech ETFs has given incredible performances so far in the year, the ultra-popular – SPDR S&P Biotech ETF (NYSEARCA: XBI ) – is not far behind. It is the third best performing ETF in the biotech space, returning nearly 39.5%. XBI in Focus With AUM of $2.3 billion and average daily volume of close to a million shares, XBI is extremely liquid and an easily traded fund. It provides equal weight exposure across 106 stocks by tracking the S&P Biotechnology Select Industry Index. This suggests that the product has no concentration issue and offers huge diversification benefits. The product has a definite tilt toward small cap securities, as mid and large caps account for only around 10% each. It charges a relatively low fee of 35 bps a year for the exposure and has a Zacks ETF Rank of 2 or ‘Buy’ rating with a High risk outlook. Several stocks in the ETF portfolio are worth noting, as these have been the real stars and have contributed much to its outstanding performance. Below, we have highlighted those five best performing stocks and each takes nearly 1% share in the fund’s basket, irrespective of its position: Best Performing Stocks of XBI Eagle Pharmaceuticals Inc. (NASDAQ: EGRX ): Based in Woodcliff Lake NJ, this specialty pharmaceutical company is focused on developing and commercializing injectable products, primarily in the critical care and oncology areas in the United States. Having a Zacks Rank of #3 (Hold), the stock surged nearly five-folds in the year-to-date time frame given its incredible growth prospect with a Growth Style Score of ‘A’. The company’s earnings are expected to grow a whopping 137.90% this year compared to industry growth projection of 9.75% and sales growth projection is also robust at 264.47% versus the industry average of 4.43%. The stock also has a solid Zacks Industry Rank in the top 39% at the time of writing. Heron Therapeutics Inc. (NASDAQ: HRTX ): Based in Redwood City, CA, this biotech company develops products using its proprietary Biochronomer polymer-based drug delivery platform to address unmet medical needs. The stock has delivered incredible returns of over 215% so far in the year and is still showing solid momentum with a Momentum Style Score of ‘A’. The stock has seen narrowing loss estimate from $2.78 per share to $2.56 per share over the past 60 days, suggesting some upside. This represents earnings growth of 10.9% year-over year, up from the industry average of 1.5% growth. HRTX has a Zacks Rank #3 and a solid Zacks Industry Rank in the top 41%. Exelixis Inc. (NASDAQ: EXEL ): The stock was recently upgraded by a notch to Zacks Rank #2 (Buy), and has climbed nearly 180% so far this year. Based in South San Francisco, the company develops and sells small molecule therapies for the treatment of cancer in the United States. Though the company’s earnings are expected to grow 42.79% year over year this year, well above the industry average of 6.43%, earnings yield is highly negative at 20.31% and worse than the industry average of 7.84%. As such, the stock currently does not pose ideal flavors of growth, value and momentum. However, it falls in a strong industry category, having a Zacks Rank in the top 42%. Retrophin Inc. (NASDAQ: RTRX ): Based in San Diego, CA, this biopharma company focuses on the development, acquisition and commercialization of drugs for the treatment of serious, catastrophic or rare diseases for which there are currently no viable options for patients. The stock, with an industry Zacks Rank in the top 42%, has gained 177% in the year-to-date time frame. Though the company’s earnings and revenues are expected to grow more than the industry average this year, its growth and value prospects are gloomy with a Growth Style Score of ‘D’ and Value Style Score of ‘F’. This is because the stock has a Zacks Rank #4 (Sell) and seen massive negative estimate revisions from a loss of 96 cents per share to a loss of $1.64 per share for the current fiscal year. This suggests some pain for this company in the coming weeks. Prothena Corp Plc (NASDAQ: PRTA ): The stock has delivered robust returns of 159% so far this year but the trend of outperformance is likely to snap in the coming weeks. This is especially true as this Zacks Rank #3 stock also has a dull Growth and Value Style score of ‘F’ each despite the strong industry Zacks Rank in the top 42%. Earnings and revenues are expected to decline 796.5% and 95.3%, respectively, for this year. Based in Dublin, Ireland, Prothena is a late-stage clinical biotechnology company focused on the discovery, development, and commercialization of protein immunotherapy programs for the treatment of diseases that involve amyloid or cell adhesion. Original Post
Left Smarting – Smart Beta Products May Not Make Bad Decisions But They Do Facilitate Them

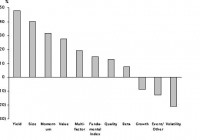
By Kevin Murphy ‘But guns don’t kill people, people do’ is a line less likely to settle an argument than provoke further discussion and yet it is not impossible to imagine an advocate of so-called ‘smart beta’ investments – strategies that try to build on simple index-tracking products by focusing in on a specific factor, such as growth, momentum or value – using a similar refrain. “But smart beta products don’t make bad investment decisions, investors do,” they might tell a doubter. To which we would reply – as we would to anyone trying the gun line – “OK, but they do make the job a lot easier.” We touched on this idea of smart beta products exacerbating investors’ well-documented inability to judge when to buy into and sell out of markets in, among other articles, Smart thinking . That piece was inspired by some fascinating work by our friends at Empirical Research Partners and, since they have recently returned to the subject, we shall too. What Empirical has done is to look at two relationships – first, between past performance and where investors put their money and, second, between where investors put their money and subsequent performance. As you can see from the chart below, for eight out of the 11 categories of smart beta strategies analysed, there is a very strong positive correlation between past performance and future fund flows, with those directing money towards yield-type exchange traded funds (ETFs) apparently the most prone to invest with at least one eye on the rear view mirror. Source: Strategic Insight Simfund, Empirical Research Partners Analysis, June 2015 Here on The Value Perspective, we have no major philosophical issue with investors putting money into areas that have performed well, if – and it is a big if – they continue to perform well. So did Empirical identify any sort of positive relationship between performance in consecutive quarters? Did funds that performed well continue to do so? The answer, as you can see from the following chart, is ‘not really’. Source: Strategic Insight Simfund, Empirical Research Partners Analysis, June 2015 Indeed, returns to yield ETFs are so mean-reverting that, as Empirical observes: “If anything, investors should be buying them after down-quarters rather than up-quarters.” As value investors, we also cannot resist pointing out how momentum ETFs have a negative correlation here too – after all, the one quality investors might think they could count on from such a strategy would be, well, momentum. One final aspect of Empirical’s research we would highlight is the finding that, on average, smart beta strategies turn over about a third of their total capitalisation every month. This would of course imply the average holding period for a smart beta investor is three months – in other words, the average holding period mirrors the time frames of fund flows and performance discussed above. The picture being painted here is of a dispiriting and, to our minds, frankly nonsensical investment routine, where your average smart beta investor sees good performance, buys it, sells up after a quarter of likely disappointing performance, buys something else that has performed well, sells up after a quarter of likely disappointing performance and on and on until, presumably, they have no money left. No doubt, the groups that run smart beta strategies would argue they are intended to allow investors to tilt their exposure to factors they believe will deliver strong performance over the longer term. The reality seems to be, however, that that is not how many people use them – choosing instead to churn smart beta ETFs in the hope of squeezing the best possible performance from quarter to quarter. As we never tire of pointing out here on The Value Perspective, nothing in life is certain but, if anything came close, it would be that such a hope is destined to end in disappointment. Ultimately, one of the supposed selling points of smart beta ETFs – the ease with which investors can pick out and trade a particular strategy – is working against them. Instead of tangible companies, complete with management teams, business models and financial statements, ETF investors are buying into ethereal concepts that are based on other people’s definitions of value or momentum, say – and, if one does not work, it is significantly easier to give up and buy an alternative. That of course is the antithesis of what value investors look to do, preferring instead to play the patient, long-term game, with an average holding period of three or five years.

Fireside Markets Episode 08: A Wealth Of Common Sense With Ben Carlson

Portfolio strategy, long/short equity “}); $$(‘#article_top_info .info_content div’)[0].insert({bottom: $(‘mover’)}); } $(‘article_top_info’).addClassName(test_version); } SeekingAlpha.Initializer.onDOMLoad(function(){ setEvents();}); In this episode of Fireside Markets, host James Osborne chats with respected blogger Ben Carlson , the voice behind A Wealth Of Common Sense . Ben has a new book about to be released, aptly titled “A Wealth of Common Sense: Why Simplicity Trumps Complexity in Any Investment Plan.” We discussed some highlights from the book, including developing a personal investment philosophy, avoiding performance-chasing behaviors, defining investment success and benchmarking your portfolio performance. Share this article with a colleague