Tag Archives: applicationtime

PHK: Is It Time To Get Out While You Still Can?

Summary Pimco High Income Fund’s premium has fallen from over 50% to around 30%. The net asset value isn’t the issue, investor perception is. I strongly recommend investors reconsider their position here before it’s too late. Pimco High Income Fund (NYSE: PHK ) is a risky investment. Although the fund has a solid performance history and has steadily paid dividends through even the “worst of times,” it trades at an extreme premium over net asset value, or NAV. It’s easy to give short shrift to that little issue when times are good, it’s harder to ignore when the tide starts to shift. And just such a shift may be taking place right now. OK, it’s got a good record I’m not going to argue that PHK is a poorly run fund. Quite the contrary, it is a well run fund. For example, over the trailing 10-year period through May, the fund’s annualized NAV total return was around 11%. Total return includes reinvested distributions. That puts the fund in the top tier of its Morningstar peers. It’s performance over the trailing three- and five-year periods were even more impressive, at 19% and nearly 18%, respectively. Equally important, the fund’s distribution has been maintained through thick and thin. That includes through the disastrous 2007 to 2009 recession that led to distribution cuts throughout the CEF industry. I have concerns with the level of the distribution , at nearly 13% based on market price and 19% based on NAV, but that doesn’t diminish the consistency with which the dividend has so far been paid. So, yes, PHK has been a well run fund. If this were an open-end mutual fund the discussion would stop right there. But it isn’t, it’s a closed-end fund. Supply and demand Closed-end funds trade on supply and demand, which means their prices can vary from their net asset values. When investors are enamored of a CEF, they bid the shares up close to or above the NAV. When investors are less sanguine they push CEFs to discount prices – often very deep discount prices. This isn’t news to anyone who follows CEFs. PHK has been a market darling. It started the year with around a 50% premium over NAV. That’s massive and only exists because of investor sentiment. Investors at the start of the year were willing to pay $1.50 for $1 worth of assets. I have suggested a couple of times that this is a big risk. That stance had garnered a mixture of agreement and hostility. Those who disagree with my concerns basically suggest that the fund is so good that it deserves the premium pricing. Looking at more recent performance, however, suggests exactly why such a rich premium is a huge risk. Over the trailing three months through June 23rd, PHK’s market price return was a decline of over 18%. That’s a rough stretch to have lived through, even if the dividend has remained stable. And while investors can argue that impressive share price gains over the years means those losses are only taking back house money that misses the point. You see, PHK’s NAV return was a positive 5.5% over that same span. And since PHK’s NAV performance was positive during this span, it’s hard to suggest that the market price performance had anything to do with the fund’s NAV performance. It seems pretty clear to me that a significant number of investors have soured on the fund. Yes, there have been changes in the number of shares of PHK that are sold short . That, presumably, should ease negative sentiment. But, in the long run, this is noise. The short interest is a symptom of the bigger issue, which is the extreme overvaluation. A warning shot If you still own PHK, look at this swift reversal of fortune as a warning shot. Could the premium go right back up to 50%? Yes. Will it? Who knows. The drop, however, is clear evidence that investor perceptions are shifting. The value of a PHK share is still roughly 30% lower than where the shares trade today. In other words, there’s still plenty of downside left before it reaches NAV. Don’t underestimate that risk. Disclosure: I/we have no positions in any stocks mentioned, and no plans to initiate any positions within the next 72 hours. (More…) I wrote this article myself, and it expresses my own opinions. I am not receiving compensation for it (other than from Seeking Alpha). I have no business relationship with any company whose stock is mentioned in this article.
NiSource Is Overvalued And Speculative

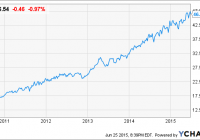
Summary NI is not suitable for either the Defensive Investor or the Enterprising Investor following the ModernGraham approach. According to the ModernGraham valuation model, the company is overvalued at the present time. The market is implying a 10.15% earnings growth over the next 7-10 years, considerably more than the rate the company has seen in recent years. Utilities often attract investors due to consistent earnings and dividend payments, and NiSource (NYSE: NI ) is no exception. Several qualitative factors make the company interesting to numerous investors. For example, Seeking Alpha contributor Josh Young recently wrote that the company’s spin off of its pipeline business makes it potentially a good value, a view that The Socially Responsible Investor also holds . Both of these articles provide great qualitative issues to consider, but one must first look at a quantitative analysis of the company. In fact, Benjamin Graham, the father of value investing, taught that the most important aspect to consider is whether the company is trading at a discount relative to its intrinsic value. It is through a thorough fundamental analysis that the investor is able to determine a potential investment’s merits. Here’s an updated look at how the company fares in the ModernGraham valuation model. This model is inspired by the teachings of Benjamin Graham and considers numerous metrics intended to help the investor reduce risk levels. The first part of the analysis is to determine whether the company is suitable for the very conservative Defensive Investor or the less conservative Enterprising Investor who is willing to spend a greater amount of time conducting further research. In addition, Graham strongly suggested that investors avoid speculation in order to remove the subjective elements of emotion. This is best achieved by utilizing a systematic approach to analysis that will provide investors with a sense of how a specific company compares to another. By using the ModernGraham method , one can review a company’s historical accomplishments and determine an intrinsic value that can be compared across industries. NI data by YCharts Defensive Investor – Must pass at least 6 of the following 7 tests: Score = 5/7 Adequate Size of Enterprise – Market capitalization of at least $2 billion – PASS Sufficiently Strong Financial Condition – Current ratio greater than 2 – FAIL Earnings Stability – Positive earnings per share for at least 10 straight years – PASS Dividend Record – Has paid a dividend for at least 10 straight years – PASS Earnings Growth – Earnings per share has increased by at least one-third over the last 10 years, using three-year averages at the beginning and end of the period – PASS Moderate PEmg (price over normalized earnings) ratio – PEmg is less than 20 – FAIL Moderate Price to Assets – PB ratio is less than 2.5 or PB x PEmg is less than 50 – PASS Enterprising Investor – Must pass at least 4 of the following 5 tests tobe suitable for a Defensive Investor: Score = 3/5 Sufficiently Strong Financial Condition, Part 1 – Current ratio greater than 1.5 – FAIL Sufficiently Strong Financial Condition, Part 2 – Debt-to-Net Current Assets ratio less than 1.1 – FAIL Earnings Stability – Positive earnings per share for at least 5 years – PASS Dividend Record – Currently pays a dividend – PASS Earnings Growth – EPSmg greater than that 5 years ago – PASS Valuation Summary Key Data Recent Price $46.54 MG Value $40.93 MG Opinion Overvalued Value Based on 3% Growth $23.43 Value Based on 0% Growth $13.74 Market Implied Growth Rate 10.15% Net Current Asset Value (NCAV) -$50.77 PEmg 28.80 Current Ratio 0.82 PB Ratio 2.26 Balance Sheet – March 2015 Current Assets $2,261,000,000 Current Liabilities $2,758,000,000 Total Debt $7,958,000,000 Total Assets $24,899,000,000 Intangible Assets $3,928,000,000 Total Liabilities $18,375,000,000 Outstanding Shares 317,400,000 Earnings Per Share 2015 (estimate) $1.73 2014 $1.67 2013 $1.70 2012 $1.39 2011 $1.03 2010 $1.01 2009 $0.84 2008 $1.34 2007 $1.14 2006 $1.14 2005 $1.04 Earnings Per Share – ModernGraham 2015 (estimate) $1.62 2014 $1.49 2013 $1.33 2012 $1.14 2011 $1.04 2010 $1.06 Dividend History NI Dividend data by YCharts Conclusion NiSource does not qualify for the Enterprising Investor or the more conservative Defensive Investor. The Defensive Investor is concerned by the low current ratio along with the high PEmg ratio, while the Enterprising Investor is only concerned with the level of debt relative to the current assets. Therefore, all value investors should only proceed with the next stage of the analysis, which is a determination of an estimate of intrinsic value, with a speculative attitude in mind. From a valuation side of things, the company has grown its EPSmg (normalized earnings) from $1.04 in 2011 to only an estimated $1.62 for 2015. This level of demonstrated growth does not support the market’s implied estimate for earnings growth of 10.15% over the next 7-10 years. The company’s recent earnings history shows an average annual growth in EPSmg of around 11.22%; however, the ModernGraham valuation model reduces such a rate to a more conservative figure, assuming some slowdown will occur. As a result, the model returns an estimate of intrinsic value falling within below the current price, indicating NiSource is overvalued at the present time. Disclosure: I/we have no positions in any stocks mentioned, and no plans to initiate any positions within the next 72 hours. (More…) I wrote this article myself, and it expresses my own opinions. I am not receiving compensation for it (other than from Seeking Alpha). I have no business relationship with any company whose stock is mentioned in this article.

3 ETFs To Buy As Housing Picks Up

Though the U.S. housing market saw a rough first quarter, sales are picking up as the spring selling season gets into full swing. The season usually warms up in March and sees maximum business till the back-to-school season in September. The spring selling season generally brings in improving sales trends. Higher job numbers, a reassuring economy, moderating home price gains, affordable interest/mortgage rates, rising rentals, recent federal initiatives to increase mortgage availability and a limited supply of inventory point to an inevitable pickup in the housing market. Even though the U.S. economy faltered in the first quarter of the year, this can mostly be attributed to the strong dollar and a harsh winter. The economy is expected to improve later this year. Rising consumer confidence, a reassuring economy and improving employment trends should lead to better home sales as the year progresses. Last year saw slowing housing price gains on stabilizing demand. The trend is expected to continue in 2015 as well. Moreover, housing should remain an affordable option in 2015, as mortgage rates are still below historical levels. Even if mortgage rates rise in the latter half of the year – as is widely anticipated – housing will likely remain reasonable. Apartment rental rates have also continued to move up, making home buying more attractive than renting. To add to the positives, plans from the White House to cut premiums on mortgage insurance should increase mortgage availability and thereby encourage home buying among first-time homebuyers. With oil prices continuing their downward journey and the economy largely on the mend, the desire to own new homes should get a shot in the arm. ETFs to Tap the Sector Given the improving fundamentals, the homebuilding sector deserves a closer look. For investors willing to play the space in a less risky way, an ETF approach can be a good idea. This technique can help to spread out assets among a wide variety of companies and reduce company-specific risk at a very low cost. Below, we have highlighted three ETFs that are worth looking into. SPDR Homebuilders ETF (NYSEARCA: XHB ) XHB is one of the more popular homebuilding ETFs in the market today, with assets under management of around $1.58 billion and a trading volume of roughly 4.28 million shares a day. The fund has an expense ratio of 35 basis points. The fund holds 37 stocks in its basket, with 50% of the assets going to mid caps and 6% comprising large-cap stocks. Despite the smaller holding pattern, the fund does not appear to be concentrated in the top 10 holdings. The fund has just 33.9% in the top 10, with Aaron’s Inc. (NYSE: AAN ), A. O. Smith Corporation (NYSE: AOS ) and Tempur Sealy International Inc. (NYSE: TPX ) occupying the top 3 positions with asset allocation of 3.84%, 3.54% and 3.41%, respectively. The fund’s assets include 32.83% homebuilders, 29.27% building products and 15.59% home furnishing retail stocks. The fund carries a Zacks Rank #3 (Hold), with a high level of risk. iShares U.S. Home Construction ETF (NYSEARCA: ITB ) Another popular choice in the homebuilding sector is ITB, which tracks the Dow Jones U.S. Select Home Construction Index. It has $2.03 billion in assets, with a trading volume of roughly 4.1 million shares a day, while its expense ratio is just 45 basis points. The fund holds 37 stocks in its basket, of which only 11% are large cap securities. The fund has a concentrated approach in the top 10 holdings, with 57.7% of its asset base invested in them. Among individual holdings, the top stocks in the ETF include D. R. Horton, Inc. (NYSE: DHI ), Lennar (NYSE: LEN ) and Pulte (NYSE: PHM ), with asset allocation of 10.61%, 10.45% and 8.30%, respectively. Homebuilders accounts for around 65% of this fund. The fund carries a Zacks Rank #3 (Hold), with a high level of risk. PowerShares Dynamic Building & Construction Portfolio ETF (NYSEARCA: PKB ) This ETF comprises around 30 housing companies, and has its assets invested across all classes of the market spectrum. Engineering and construction stocks comprise 21% of the fund, followed by building materials companies that account for 17%. A look at the style pattern reveals that the fund has a preference for growth stocks. The fund manages an asset base of $56.4 million, and has an expense ratio of 63 basis points. The fund has only 15% in large cap securities and 46.3% in the top 10 holdings. The fund carries a Zacks Rank #3 (Hold), with a high level of risk. To Sum Up While the housing market slowed down in the first quarter, homebuilders are increasingly optimistic of the spring selling season. However, increasing competitive pressure and rising land and construction cost amid moderating home price increases are the headwinds in the housing market. Original Post