Tag Archives: applicationtime

Rising Correlations With Greece In Graphs

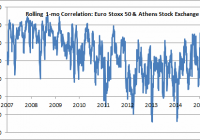
Graphical depiction of the correlation between Greek stocks and the rest of the Eurozone. Correlations have been rising as we careen towards a hard deadline on an extension of the current bailout agreement. If a disorderly outcome in Greece unduly drags down stocks in core countries disproportionately, long-term investors should view it as an opportunity. With the Euro-area finance ministers denying Greece a short-term extension of the country’s bailout and with no future financing in place, we are in for a potentially tumultuous week ahead. The Greek government in turn has called for a referendum vote on demands international creditors have made on the country in exchange for ongoing financial aid. Correlations between the exchange between the Euro Stoxx 50 (NYSEARCA: FEZ ) and the Athens Stock Exchange (NYSEARCA: GREK ) have been rising in recent weeks as the ebbing market perception of the likelihood of a deal is felt throughout the continent’s equity markets. Source: Bloomberg As recently as the end of March, the rolling one-month correlation between Greek stocks and a broad gauge of Eurozone stocks was zero. This makes intuitive sense. Greek stocks were subject to increased volatility following the election of the anti-austerity Syriza party in late January. European stocks were rebounding on the back of strengthening European economic data, but Greek stocks were being pulled lower due to the increased uncertainty around its financing package. In recent weeks, Greek stocks and their European counterparts have been seeing heightened correlation as graphed above. If broader European stocks hit an air pocket next week in the face of the Greek referendum vote, broader European stocks could be pulled down unduly in sympathy amidst this heightened correlation. The median company in the Euro Stoxx 50 has a market capitalization six times larger than bottler Coca-Cola Hellenic, the largest company in Athens Stock Exchange, which represents nearly one-fifth of that index. European stocks are being led by the nose by an economy that makes up less than two-percent of its economic output. As I wrote following my recent trip to Greece , if there is a disorderly outcome, the European financial system should be much better equipped given stronger capital ratios, new stability mechanisms, the deployment of quantitative easing, and lower sovereign yields in the periphery. Near-term dislocations due to outsized correlations with Greek stocks and that of the rest of Europe should be viewed as a longer-term opportunity to grab exposure to developed markets that have lagged the performance of the United States post-crisis and could potentially deliver higher forward returns . Disclaimer : My articles may contain statements and projections that are forward-looking in nature, and therefore inherently subject to numerous risks, uncertainties and assumptions. While my articles focus on generating long-term risk-adjusted returns, investment decisions necessarily involve the risk of loss of principal. Individual investor circumstances vary significantly, and information gleaned from my articles should be applied to your own unique investment situation, objectives, risk tolerance, and investment horizon. Disclosure: I/we have no positions in any stocks mentioned, and no plans to initiate any positions within the next 72 hours. (More…) I wrote this article myself, and it expresses my own opinions. I am not receiving compensation for it (other than from Seeking Alpha). I have no business relationship with any company whose stock is mentioned in this article.
Opportunities In Utilities For Dividend Investors?

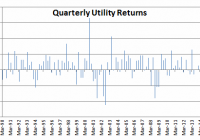
Summary Utilities have produced their worst quarterly returns in 2015 since the financial crisis. Higher interest rates have disproportionately hurt rate-sensitive sectors like utilities. In a relatively fully valued market, the relative underperformance of utilities may present investors an opportunity. The S&P 500 Utility Index, replicated by the Utilities Select Sector SPDR ETF (NYSEARCA: XLU ), has produced a -9.96% return to begin 2015, trailing the S&P 500 (NYSEARCA: SPY ) by over 12%. What has happened? The increase in Treasury yields disproportionately disfavored bond-like stocks with high dividend payouts including utilities and telecom. The trailing dividend yield on the Utilities ETF is now 3.69%. Investors have punished equity sectors with more fixed income-like return streams. After a -5.17% return in the first quarter, the utility index has followed up with a -5.05% return so far in the second quarter. These are the worst returns for the sector since the financial crisis when risk premia on all assets increased as graphed below: Source: Standard and Poor’s; Bloomberg Comparison Versus Bonds For the pounding that interest rate sensitive stocks have taken in 2015, the yield on XLU is still higher than the yield on iShares iBoxx Investment Grade Corporate Bond Index ETF LQD at 3.43%. For the same cash flow stream, I would rather own the equity upside of being a utility shareholder than be the leverage provider by owning their corporate bonds. The -9.96% loss on XLU in the first half has been larger than the -7.54% return on the Barclays Long Treasury Index as proxied by the iShares 20+ Year Treasury Bond ETF (NYSEARCA: TLT ). Conclusion I believe that the utility sector is now relatively cheap, and should be viewed as increasingly attractive to the large Income Investing community on Seeking Alpha. However, I use the term relative as I still expect forward returns on domestic assets to be subnormal . The index I have used as my sector proxy in this article features both gas and electric utilities, fully regulated and a mix of regulated and unregulated business, and features companies located in geographies with different growth trajectories. These utility stocks, at 15.9x trailing earnings, are still collectively trading at a 8% discount to the price Berkshire Hathaway paid for NV Energy in 2013 . Since that purchase in June 2013, the earnings multiple on the broader market has expanded by 13%. Consider this a margin of safety discount to a purchase made by an investor that has a long history of traditionally not paying full sticker price. When Berkshire Hathaway’s ( BRK.A , BRK.B ) MidAmerican Energy Holdings unit bought Pacificorp in 2006, it was reported in Electric Utility Week that Buffett told Oregon regulators that owning utilities was “not a way to get rich – it’s a way to stay rich.” In 2015, utilities have gotten 12% cheaper relative to the rest of the market. Perhaps utilities present dividend-paying investors with long-term horizons an opportunity in a relatively fully valued equity market. Disclaimer: My articles may contain statements and projections that are forward-looking in nature, and therefore inherently subject to numerous risks, uncertainties and assumptions. While my articles focus on generating long-term risk-adjusted returns, investment decisions necessarily involve the risk of loss of principal. Individual investor circumstances vary significantly, and information gleaned from my articles should be applied to your own unique investment situation, objectives, risk tolerance, and investment horizon. Disclosure: I am/we are long SPY. (More…) I wrote this article myself, and it expresses my own opinions. I am not receiving compensation for it (other than from Seeking Alpha). I have no business relationship with any company whose stock is mentioned in this article.

The Phases Of An Investment Idea

Investing ideas come in many forms: Factors like Valuation, Sentiment, Momentum, Size, Neglect… New technologies New financing methods and security types Changes in government policies will have effects, cultural change, or other top-down macro ideas New countries to invest in Events where value might be discovered, like recapitalizations, mergers, acquisitions, spinoffs, etc. New asset classes or subclasses Durable competitive advantage of marketing, technology, cultural, or other corporate practices Now, before an idea is discovered, the economics behind the idea still exist, but the returns happen in a way that no one yet perceives. When an idea is discovered, the discovery might be made public early, or the discoverer might keep it to himself until it slowly leaks out. For an example, think of Ben Graham in the early days. He taught openly at Columbia, but few followed his ideas within the investing public because everyone was still shell-shocked from the trauma of the Great Depression. As a result, there was a large amount of companies trading for less than the value of their current assets minus their total liabilities. As Graham gained disciples, both known and unknown, they chipped away at the companies that were so priced, until by the late ’60s there were few opportunities of that sort left. Graham had long since retired; Buffett winds up his partnerships, and manages the textile firm he took over as a means of creating a nascent conglomerate. The returns generated during its era were phenomenal, but for the most part, they were never to be repeated. Toward the end of the era, many of the practitioners made their own mistakes as they violated “margin of safety” principles. It was a hard way of learning that the vein of financial ore they were mining was finite, and trying to expand to mine a type of “fool’s gold” was not a winning idea. Value investing principles, rather than dying there, broadened out to consider other ways that securities could be undervalued, and the analysis process began again. My main point this evening is this: when a valid new investing idea is discovered, a lot of returns are generated in the initial phase. For the most part they will never be repeated because there will likely never be another time when that investment idea is totally forgotten. Now think of the technologies that led to the dot-com bubble. The idealism, and the “follow the leader” price momentum that it created lasted until enough cash was sucked into unproductive enterprises, where the value was destroyed. The current economic value of investment ideas can overshoot or undershoot the fundamental value of the idea, seen in hindsight. My second point is that often the price performance of an investment idea overshoots. Then the cash flows of the assets can’t justify the prices, and the prices fall dramatically, sometimes undershooting. It might happen because of expected demand that does not occur, or too much short-term leverage applied to long-term assets. Later, when the returns for the investment idea are calculated, how do you characterize the value of the investment idea? A new investment factor is discovered: it earns great returns on a small amount of assets applied to it. More assets get applied, and more people use the factor. The factor develops its own price momentum, but few think about it that way The factor exceeds the “carrying capacity” that it should have in the market, overshoots, and burns out or crashes. It may be downplayed, but it lives on to some degree as an aspect of investing. On a time-weighted rate of return basis, the factor will show that it had great performance, but a lot of the excess returns will be in the early era where very little money was applied to the factor. By the time a lot of money was applied to the factor, the future excess returns were either small or even negative. On a dollar-weighted basis, the verdict on the factor might not be so hot. So, how useful is the time-weighted rate of return series for the factor/idea in question for making judgments about the future? Not very useful. Dollar weighted? Better, but still of limited use, because the discovery era will likely never be repeated. What should we do then to make decisions about any factor/idea for purposes of future decisions? We have to look at the degree to which the factor or idea is presently neglected, and estimate future potential returns if the neglect is eliminated. That’s not easy to do, but it will give us a better sense of future potential than looking at historical statistics that bear the marks of an unusual period that is little like the present. It leaves us with a mess, and few firm statistics to work from, but it is better to be approximately right and somewhat uncertain, than to be precisely wrong with tidy statistical anomalies bearing the overglorified title “facts.” That’s all for now. As always, be careful with your statistics, and use sound business judgment to analyze their validity in the present situation. Disclosure: None