Tag Archives: applicationtime

Tough Choices: Alternative Funds In 2015

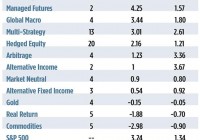
The Oxford English Dictionary provides two definitions of the adjective “alternative.” In one, the term is used to describe something “available as another possibility or choice.” The other, more proscriptive definition pronounces the choice between two things as “mutually exclusive.” In what context are we to view “alternative investments” or “alts”? Are they portfolio adjuncts or replacements? These nontraditional assets are, for the most part, utilized for risk diversification within a portfolio, not as a portfolio themselves, so it’s good to keep this in mind when reviewing performance records. Yes, returns are important but so, too, are correlation and other dynamics. Ideally, alts should be the yin to a portfolio core’s yang. Once available only to well-heeled investors through privately placed hedge funds, an increasing number of alternative investment strategies can now be found in mutual fund and exchange traded product wrappers. The array of retail-sized alts has, in fact, become dazzling. Last year, 109 liquid alt products debuted and this year’s shaping up to be similarly fecund. Through May, 54 new funds have been launched. This proliferation is a recent phenomenon, though. Relatively few liquid alt products can truly be considered seasoned. All told, when the alt universe is culled for funds with track records extending five years or more, just 68 candidates squeak through. So how have these time-tested funds fared in 2015? Just three categories–risk parity, managed futures and global macro-have outdone the broad-based domestic equity market through mid-year. In some cases, that’s to be expected; the idea is that these funds will dampen volatility of an overall portfolio and provide some cushion for a falling market. For many alts, that thesis has yet to be tested, of course, and in an extended bull market, it gets harder to make the case for funds that don’t keep up. So here, we’ll concentrate on the strategies that have enhanced returns over the broader market. Risk Parity Risk parity? What’s that? An in-depth examination of risk parity strategies can be found in REP. ‘s March issue, but the quick-and-dirty is this: These portfolios allocate assets on the basis of risk, not dollars. Typically, risk is balanced by overweighting lower-volatility assets. The granddaddy of risk parity funds is the AllianceBernstein Global Risk Allocation Fund (MUTF: CABNX ), which keys on tail risk to invest in an array of global asset classes. “Tail risk” refers to the probability of a significant downside event. Allocations are made so that each class contributes equally to the fund’s expected tail loss. Through May, CABNX rose 4.51 percent, comfortably ahead of the 3.24 percent contemporaneous gain in the SPDR S&P 500 Trust ETF (NYSEARCA: SPY ). CABNX’s year-to-date gain came in second to that of its category mate, the AMG FQ Global Risk-Balanced Fund (MUTF: MMAFX ). The AMG portfolio, which recorded a 5.13 percent total return through May, primarily relies on derivatives to dynamically balance risk. Over a five-year span, these risk parity funds have done yeoman’s work, coming in second behind hedged equity products in average annual returns. Still, given the strength of the protracted stock market rally, alpha-positive alpha, that is-remains elusive. Managed Futures The case for short-enabled active management was emphatically made in the commodities sector this year. Unlike commodity index trackers, actively managed futures funds can short-sell with as much abandon as they can buy. Margin’s the same, and so too the practical risk for either a long or short market stance. And a good thing that was for fund runners this year. Most of 2015’s commodity price action has been to the downside, primarily led by plummeting tariffs for oil. The Equinox MutualHedge Futures Strategy Fund (MUTF: MHFAX ) capitalized upon this trend and other tactics by allocating its assets to several subadvisors with diverse trading styles. Through May, MHFAX gained 5.27 percent, outdoing the 3 percent earned by its single-manager category mate, the Guggenheim Managed Futures Strategy Fund (MUTF: RYMTX ). Over the long run, managed futures have been a middling performer on the alts stage, but still have handily outperformed long-only commodity actors. Global Macro Big picture investing paid off in 2015’s first half as global macro products collectively eked out a 20 basis point advantage over the gain earned by an S&P 500 proxy. Global macro strategies bank on forecasts and trends in systemic factors such as interest rates, policy changes and fund flows. Leading the charge, the PIMCO Global Multi-Asset Fund (MUTF: PGAIX ) returned a best-of-class 6.35 percent through May. PGAIX fund runners allocate assets across a spectrum of equities, fixed income securities and commodities, utilizing a top-down approach enhanced by some bottom-up alpha-seeking tactics. Tail risk hedging is also employed to insulate the portfolio. That said, PGAIX isn’t the least volatile fund in the category, but neither is it the most. The Ivy Asset Strategy Fund (MUTF: WASAX ) actually has the best five-year Sharpe ratio (0.74) in the category, but its inherent volatility can take investors on a bit of a roller coaster ride. What’s Not Hot This year’s laggards are physical assets-gold, real return assets and commodities. No surprise there, given the disinflationary mood in early 2015. All five seasoned commodities funds were under water through May, some significantly more than others. The tiny Rydex Commodities Strategy Fund (MUTF: RYMEX ) floated just below the surface with a -0.72 percent return while the Direxion Indexed Commodity Strategy Fund (MUTF: DXCTX ) foundered with a 5.54 percent loss. Such disparate performance arises because the funds track dissimilar indices: DXCTX a long/flat benchmark comprised of a dozen commodities and RYMEX a broader-based long-only construct. Real return funds pursue strategies that seek to outperform the broad equity market during periods of rising inflation. Typically, these funds invest in a portfolio of “real” assets including interests in residential property, energy, metals and agriculture. Three of the five real return portfolios were actually above water in May, but because the behemoth PIMCO Commodity Real Return Strategy Fund (MUTF: PCRIX ) commands an 89 percent market share, its 2.24 percent loss dragged the category return down. Three of four senior gold funds, tracking the metal’s spot price assiduously, ended May at pretty much the same level as the year’s start. One portfolio, the PowerShares DB Gold ETF (NYSEARCA: DGL ), which replicates the returns of gold futures rather than bullion, underperformed the others, largely due to the continuous costs of rolling expiring contracts forward. The Road Ahead If you look at the five-year track records recapped in Table 2, one thing becomes readily apparent: the higher a category’s correlation to the broad market, the better its performance. The average annual returns of the top five categories, all pegged against the S&P 500, line up perfectly with their r-squared correlations. No doubt, those funds have basked in the warmth of a torrid equity market. The stock rebound will one day turn to a dribble and when it does, the out-of-favor categories will have an opportunity to rise to the top of the league table. It’s then that the alpha column is more likely to be populated by positive numbers. This article originally appeared in the July issue of REP. Magazine and online at WealthManagement.com .
EWM: Does This Former Tiger Economy Merit A Closer Look?

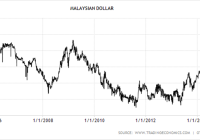
Summary Malaysia has steadily weaned itself off oil revenues and reduced the budget deficit by introducing new taxes and reducing subsidies. Despite high growth, 2.3% inflation and strong foreign currency reserves, the Malaysian dollar has weakened and is close to global financial-crisis lows. Expensive valuations, meager earnings growth and political instability do not provide many incentives to invest in EWM. With a GDP per capita of $12,127, Malaysia is the richest nation state in Southeast Asia. Many investors have avoided Malaysia due to political uncertainties and an over reliance on oil for government revenues. On March 2014, the judiciary found the opposition leader, Anwar Ibrahim, guilty of sodomy and jailed him for five years. While the political situation has not calmed since the verdict, Prime Minister Najib Razak has continued to liberalize the economy. Reforms As of 2015, Malaysia is the 14th most competitive economy in the world, ranked higher than countries like Australia, United Kingdom, South Korea and Japan. Subsidy reforms have not only improved competitiveness but have also bolstered the government’s balance sheet. In December 2014, the government ended all fuel subsidies, saving $5.97 billion annually . The minimum quota for Malay ownership in publicly traded companies has been lowered from 30 percent to 12.5 percent. Changing Economy Economic growth comes with problems as Malaysia’s attractiveness for lower-wage manufacturing has diminished as average wage levels have increased, making Malaysia an upper middle-income country. The government has championed efforts to become the world’s center of Islamic Finance, promoting an appreciation of the currency, even at the cost of exporters. As a result, Malaysia is the global leader in the sukuk (Islamic bond) market, issuing US$17.74 billion worth of sukuk in 2014 – over 66.7% of the global total of US$26.6 billion. Government Budget The Government is hugely reliant on Oil-based revenues from Petronas but has managed to diversify its income sources. While 30% of the government’s total revenue in 2014 still came from oil-based sources, the proportion is lower than 40% in 2009. To further reduce dependence on oil, the government implemented a 6% goods and services tax in April 2015. Due to such measures and a reduction in subsidies, the government debt to GDP ratio has returned to 2010 levels of 52.8%. Currency The Malaysian Dollar (also known as the Ringgit) has been subject to capital controls since September 1998, a consequence of the 1997 Asian financial crisis. The currency was pegged to the dollar at 3.80 from 1998 to 2005. Malaysia ended the peg on July 2005, but the currency is still a managed float, trading within ranges deemed acceptable by the national bank. The currency steady strengthened against the U.S. dollar until the 2013 taper tantrum. (click to enlarge) Despite the weaker currency, the economy has not been stronger since the financial crisis. The economy posted 6.0% GDP growth in 2014 and has averaged 2.3% inflation in the past five years. The benchmark interest rate of 3.25 is unchanged since September 2014, with only one rate hike in the past four years. However, the Current Account to GDP % has decreased from above 15% pre-financial crisis to just 5.7% in the past few years. This decline is unlikely to reverse course as Malaysians utilize their higher incomes to purchase imported goods. Still, the economy is likely to withstand a Fed tightening cycle with over $97 billion in foreign currency reserves . iShares MSCI Malaysia ETF ( EWM) Holdings (click to enlarge) The table above contains the top 16 components of EWM by weight. It should be noted that the numbers presented here, differs from data provided by iShares. While the discrepancy is partially due to the 28.4% weight I did not consider, I believe other factors are at play. For example, the WSJ and iShares disagree on the S&P P/E and dividend yield. The data in the above table was collected from malaysiastock.biz Financial stocks have the highest weight in the ETF at 31% and account for 3 of the top 4 holdings. There is also a divergence in growth between Public Bank ( OTC:PBLOF ) & Malayan Banking ( OTCPK:MLYBY ) vs CIMB ( OTCPK:CIMDF ) & AMMB ( OTC:AMMHF ). The former has enjoyed double digit revenue growth compared the latter at single digits and therefore commands a P/B premium. The utilities are not dividend paying income stocks; rather they are positioned for growth. Both Tenaga Nasional ( OTCPK:TNABY ) and Petronas Gas ( OTC:PNADF ) have dividend yields of 2%, below the 3% yield for the whole ETF. They tend to invest more of their earnings into projects which supply growing electricity demand. Tenaga appears to be the cheapest stock in the ETF but it is merely enjoying the drop in commodity prices last year. The telecoms and financial stocks pay the highest dividends and are the cheapest on a Price/Cash Flow basis. The only consumer staples stock and the only materials stock in the top 16 have negative revenue growth, showing how these sectors are struggling in every market. The stocks with the highest growth rates, the healthcare stock IHH ( OTCPK:IHHHF ) and the consumer discretionary stocks of Genting ( OTC:GEBEY ) also have higher P/E ratios than average. The ETF does not present a bargain in individual stocks or as a whole. The dividend yield is only 1% than yields on developed market stocks. 5yr CAGR growth rates at single digits suggests that there is not much growth to be had by investing in Malaysia. While the P/B and P/Cash Flow ratios seem cheap, it’s only due to the high weighting of financials in the ETF. Conclusion Investing in EWM over the iShares MSCI Emerging Markets ETF (NYSEARCA: EEM ) is not a value, growth or income proposition. While the reforms taken by Prime Minister Najib Razak are encouraging, the political scene remains frothy. An internal power struggle between the PM and his mentor has erupted and respected business leaders are openly criticizing government policies. A possible Fitch downgrade over the $11.5 Billion debt of 1Malaysia Development Berhad (1MDB), a state-owned investment company should also concern current EWM investors. While moves taken to reduce the budget deficit and reliance on oil are encouraging, it would be wiser to revisit the ETF after the Fed raises rates and the political situation improves. Editor’s Note: This article discusses one or more securities that do not trade on a major U.S. exchange. Please be aware of the risks associated with these stocks. Disclosure: I/we have no positions in any stocks mentioned, and no plans to initiate any positions within the next 72 hours. (More…) I wrote this article myself, and it expresses my own opinions. I am not receiving compensation for it (other than from Seeking Alpha). I have no business relationship with any company whose stock is mentioned in this article.

Best And Worst: Small Cap Value ETFs, Mutual Funds And Key Holdings

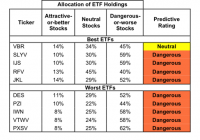
Summary Small Cap Value ranks 11th in 2Q15. Based on an aggregation of ratings of 16 ETFs and 287 mutual funds. VBR is our top rated Small Cap Value ETF and SPSCX is our top rated Small Cap Value mutual fund. The Small Cap Value style ranks 11th out of the 12 fund styles as detailed in our 2Q15 Style Rankings report . It gets our Dangerous rating, which is based on aggregation of ratings of 16 ETFs and 287 mutual funds in the Small Cap Value style. Figures 1 and 2 show the five best and worst rated ETFs and mutual funds in the style. Not all Small Cap Value style ETFs and mutual funds are created the same. The number of holdings varies widely (from 14 to 1511). This variation creates drastically different investment implications and, therefore, ratings. Investors should not buy any Small Cap Value style ETFs or mutual funds because only one gets an Attractive-or-better rating, but it has below $100 million in total net assets. If you must have exposure to this style, you should buy a basket of Attractive-or-better rated stocks and avoid paying undeserved fund fees. Active management has a long history of not paying off. Figure 1: ETFs with the Best & Worst Ratings – Top 5 (click to enlarge) * Best ETFs exclude ETFs with TNAs less than $100 million for inadequate liquidity. Direxion Value Line Small and Mid Cap High Dividend ETF (NYSEARCA: VLSM ) and First Trust Mid Cap Value AlphaDEX ETF (NYSEARCA: FNK ) are excluded from Figure 1 because their total net assets are below $100 million and do not meet our liquidity minimums. Figure 2: Mutual Funds with the Best & Worst Ratings – Top 5 (click to enlarge) * Best mutual funds exclude funds with TNAs less than $100 million for inadequate liquidity. Vanguard Small-Cap Value ETF (NYSEARCA: VBR ) is the top-rated Small Cap Value ETF and Sterling Capital Behavioral Small Cap Value (MUTF: SPSCX ) is the top-rated Small Cap Value mutual fund. Both earn a Neutral rating. One of our favorite stocks held by VBR is Goodyear Tire and Rubber Company (NASDAQ: GT ). In 2014, Goodyear earned an after-tax operating profit ( NOPAT ) of almost $1.4 billion, its highest ever in our model. Despite a 7% revenue decline, the company’s NOPAT was up over 11% year over year. Longer term, NOPAT has risen by 24% compounded annually since 2009. This is a direct result of cost of sales that declined 26% and SGA that declined 4% from 2011, bringing total expenses down by 21%. All of this expense trimming has raised Goodyear’s after-tax margins to almost 8%, up from 4% in 2012 and its return on invested capital ( ROIC ) from under 6% in 2012 to 9% today. Goodyear Tire was our Stock Pick of the Week several weeks ago. Despite the positive growth of the business, the stock is undervalued. If Goodyear can grow NOPAT by just 1% compounded annually for the next 10 years , the company is worth $37/share – a 19% upside from current levels. It will be difficult for Goodyear to fail to beat expectations as low as these when considering the company’s historical profit growth rate since 2000 is 18% compounded annually. PowerShares Fundamental Pure Small Value Portfolio (NYSEARCA: PXSV ) is the worst rated Small Cap Value ETF and Aston River Road Independent Value Fund (MUTF: ARIVX ) is the worst rated Small Cap Value mutual fund. PXSV earns a Dangerous rating and ARIVX earns a Very Dangerous rating. One of the worst rated stocks held by Small Cap Value funds is Almost Family Inc. (NASDAQ: AFAM ). Almost Family provides home health services throughout the United States. Since 2010, Almost Family’s NOPAT has declined from $32 million to $15 million in 2014, a decline of 17% compounded annually. ROIC has also seen a similar decline, down from 19% to 5% over the same timeframe. Almost Family has also generated negative economic earnings for the past two years. Considering the lack of growth shown above, AFAM is currently overvalued. To justify its current price of $39/share, the company would need to grow NOPAT by 15% compounded annually for the next 11 years . This seems very optimistic given that AFAM’s NOPAT has declined since 2010. Figures 3 and 4 show the rating landscape of all Small Cap Value ETFs and mutual funds. Figure 3: Separating the Best ETFs From the Worst ETFs (click to enlarge) Figure 4: Separating the Best Mutual Funds From the Worst Funds (click to enlarge) Sources Figures 1-4: New Constructs, LLC and company filings Disclosure: David Trainer and Allen L. Jackson receive no compensation to write about any specific stock, style, style or theme. Disclosure: I/we have no positions in any stocks mentioned, and no plans to initiate any positions within the next 72 hours. (More…) I wrote this article myself, and it expresses my own opinions. I am not receiving compensation for it. I have no business relationship with any company whose stock is mentioned in this article.