Tag Archives: applicationtime

Duke Energy Should Be On An Income Investor’s List

The company is streamlining its operations and focus on growth should propel its stock price. Increased revenues and cash flows from growth projects should result in increased dividend growth. Current price represents a good entry point for long term investors. Duke Energy (NYSE: DUK ) has had mixed fortunes over the past five quarters. The revenues and earnings of the company have been fluctuating, which is odd for a large utility like Duke. The trend in the stock price has been consistent with the trend in its revenues and earnings over the last twelve months. It touched $90 in January but could not maintain that level and the stock has been on a declining trend over the last six months. This, I believe, has created a good entry point for income investors. Duke Energy has been repositioning its business by selling its competitive business assets. The company has strategic growth plans that involve getting an extended, renewable energy generation asset base; such plans will benefit the company in the long-run, as the company’s revenue and cash flow growth will improve which will reduce shareholder risk and maintain investors’ confidence in the longer term. The company is seeking an opportunity to invest in Green projects worth $4 billion which will further boost its growth. It has also plans for the accelerated investments in solar, biomass and natural gas. Duke also plans to convert its coal field plants to natural gas ones in order to have larger asset base. However, this is a long-term investment, approximately 4 to 5 years horizon should be kept in mind. It will be a joint venture to service more territories with expanded gas generation. As a result, this huge investment will boost growth that in return will increase revenues and maintain stable cash flow base. This will have a significant positive affect on the DUK’s share price. On the other hand, the recent sale of non-regulated Midwest assets and the subsequent buy back of shares will increase the company’s earnings per share. It will also allow DUK to repay debt and make its financial position stronger. Duke Energy also has plans to access some cash, in the form of unremitted international business earnings, in the next 8 years that will have a positive effect on its performance. This will allow the company to grow its profitable operations and expand its natural gas pipelines in North Carolina, as discussed above, to cater for more demand. Furthermore, the cash from international business segments will finance future growth and create value for its shareholders in the longer term. Duke energy is a good investment for income investors – it yields a return of 4.1%, with dividends paid quarterly. All of the above repositioning strategies will accelerate dividend growth for the shareholders. It will also improve the overall business risk of DUK and make investors more confident as it will also lower the shareholders’ risk. However, the company will remain exposed to the risk of sudden changes in regulatory restrictions. In addition, any carelessness exhibited by company’s management during the execution of its planned investment might hinder its future growth potentials. Furthermore, unforeseen negative economic changes, foreign currency volatility and adverse weather conditions are key risks that might restrict its stock price performance in the years ahead. Duke’s long term prospects look good. However, with the demand growth in the US expected to slow in the coming years, Duke Energy might face some difficulties on the revenues front in the domestic market. As a backup plan, it can still generate growth with its international energy business by focusing on overseas operations. Duke has effectively modified its portfolio with wind and solar power projects lined up for the future. Most importantly, this company also remains committed towards enhancing operational efficiency and cutting down costs to further fuel earnings growth. In conclusion, Duke Energy had a successful 2014, is off to another strong one this year, and if all goes according to the plan, it will pass along another dividend increase to shareholders very soon. The company’s share price is currently following a declining trend, but with revenues and earnings expected to rise due to the growth projects, there is a lot of upside to the share price. For income investors looking for a stable, secure, high-yield investment opportunity, Duke Energy should certainly be considered. Disclosure: I am not a registered investment advisor and the views expressed in this article are my own. These views should not be taken as an investment advice or recommendation to buy or sell the shares. Investors should conduct their own due diligence before making an investment decision. Disclosure: I/we have no positions in any stocks mentioned, and no plans to initiate any positions within the next 72 hours. (More…) I wrote this article myself, and it expresses my own opinions. I am not receiving compensation for it (other than from Seeking Alpha). I have no business relationship with any company whose stock is mentioned in this article.
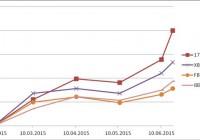
40% Return In ~4 Months With Our IP Selected Healthcare Companies Since SA Publication

Summary Portfolio consisting of 17 healthcare companies would have returned nearly 40% from February 10th 2015 (date of article publication on SA) to June 18th 2015. Outperformance exclusively obtained with Patent Dynamics/Patterns (IP models) with XBI, FBT and IBB as benchmarks. Expert and/or financial analysis may be combined with such IP models for even better returns. Tickers covered: JAZZ, SAGE, TNXP, SGYP, ASPX, XNPT, INSM, RNN, NVDQ, ZSPH, ACUR, ICPT, RDHL, CORI, SPNC, EBIO and HAE. We wanted to know how the ” 17 Healthcare Companies To Consider Based On Patent Dynamics And IP/Patent Indexes ” performed since SA publication on February 10th 2015, namely JAZZ, SAGE, TNXP, SGYP, ASPX, XNPT, INSM, RNN, NVDQ, ZSPH, ACUR, ICPT, RDHL, CORI, SPNC, EBIO and HAE. Results below are impressive taking into account that these companies were only selected using Patent Dynamics/Patterns within these companies. This represents another evidence of the utility to take into account Patent Dynamics/Patterns in any investment selection process. Moreover, complementing or combining such patent filtering criteria with a financial/expert analysis and/or active management would have probably resulted in an even higher return on investment. Results: I. Performance of the 17 companies from February 10 th 2015 to June 18 th 2015 COMPANY TICKER EXCHANGE PERF% Synergy Pharmaceuticals SGYP NDQ 211.90 Corium International CORI NDQ 109.67 Sage Therapeutics SAGE NDQ 97.65 Acura Pharmaceuticals ACUR NDQ 83.33 Tonix Pharmaceuticals TNXP NDQ 77.55 Auspex Pharmaceuticals Inc ASPX NDQ 65.48 Redhill Biopharma Ltd RDHL NDQ 55.19 Insmed, Inc. INSM NDQ 51.36 Intercept Pharmaceuticals ICPT NDQ 32.01 ZS Pharma, Inc. ZSPH NDQ 24.15 Jazz Pharmaceuticals JAZZ NDQ 7.55 Haemonetics Corp HAE NYS 0.21 XenoPort, Inc. XNPT NDQ -3.34 Rexahn Pharmaceuticals, Inc. RNN NYS -9.33 Novadaq Technologies NVDQ NDQ -15.91 The Spectranetics Company SPNC NDQ -19.17 Eleven Biotherapeutics EBIO NDQ -74.21 70% of the companies have positive performance (30% negative). To note that ASPX was acquired by Teva Pharmaceuticals ( announcement on March 2015 ). II. What would have been the return of a portfolio composed of these 17 companies? A portfolio consisting of these 17 healthcare companies would have returned nearly 40% from February 10 th 2015 to June 18 th 2015 (in a bit more than four months) . This is to be compared with biotech ETFs like XBI, FBT or IBB returning respectively 26.66%, 15.67% and 18.73%. Hence, this represents a strong outperformance by applying Patent Dynamics/Patterns only versus benchmarks. Return is based on an equally weighted portfolio rebalanced each month. Cumulative performance of the 17 healthcare companies versus benchmarks (XBI, FBT and IBB) (click to enlarge) Table: Monthly performance and cumulative return of the 17 healthcare companies versus benchmarks (XBI, FBT and IBB) DATE MONTHLY PERF 17 Healthcare XBI-MONTH XBI FBT-MONTH FBT IBB-MONTH IBB 10.02.2015 N/A 100.00 N/A 100.00 N/A 100.00 N/A 100.00 10.03.2015 11.05 111.05 13.60 113.60 9.97 109.97 7.28 107.28 10.04.2015 7.75 119.66 1.77 115.61 2.02 112.19 4.69 112.31 11.05.2015 -1.32 118.08 -1.70 113.65 -2.18 109.75 -1.44 110.69 10.06.2015 8.26 127.84 7.38 122.03 3.17 113.22 3.84 114.95 18.06.2015 9.40 139.86 3.79 126.66 2.16 115.67 3.29 118.73 Focusing only on the Rating provided by the IP model (see article), we might have done even better in terms of performance by changing the weight of each company as the worst performer EBIO (-74.2%) had a Rating of D (worst form Ratings from A to D), whereas the two best performers SGYP (+211.9%) and CORI (+109.67%) had A Ratings. As mentioned, financial analysis and/or active management might have contributed as well to improve the performance. If we take for example the worst performer EBIO, disappointing results were released . Taking into account financial and/or expert analysis, one would have probably sold or reduced the weight of EBIO, see for example financial analysis indicated that caution was warranted , precursor sell signal or the comment from SA user businessofbiotech : “Eleven Bio’s lead product candidate fails in Phase 3 study; shares plunge 78% [ View news story ] Anyone with the slightest knowledge of dry eye and bit more attention to the press release of Phase 2 results would have never invested in this company. In their press release they mentioned they achieved statistical significance from baseline to end of tx, but not between the groups. They gave the false impression that their drug worked by showing decrease in the frequency of artificial tears (not an FDA approvable endpoint). The CEO knew the drug was a bust and she still took the company public on the false hope of their technology platform. Now she is trying to sell the hope that this drug will work in allergic conjunctivitis….One word- RUNNNN!!!” What to do next? The IP models provide some indications on what to do with those companies at the present time as their Grade, Score or Patent Index might have changed since the February publication (some slight modifications have been made to the models so the grade as published in February 2015 might not always correspond to the ones in the table below). The following recommendations are therefore only based on the IP models (with the exception of recent run up). It is recommended to combine the present IP approach with a financial and/or expert analysis. For JAZZ, Grade has changed from A to C, with a Score declining from 2 to 1, and with a present Patent Index (PI=3) smaller than the maximum Patent Index (PIMax=4). A PI

Funds For A Crazy Volatile Market

Even though I believe the market is ready for at least a 5-10% correction, I always keep a good part of our portfolios and our clients’ portfolios invested. Why? For these reasons… resulting in these buys! Why? Because the market goes up, not down, about two-thirds of the time. Because no one has a crystal ball. Because we believe in building a Lifetime Portfolio. And because great companies have a way of protecting “somewhat” on the downside by the power of their ability to keep their earnings strong and increase their market share. This makes them less ulcer-producing, as do the kinds of mutual funds that own such gems. One such ulcer-averse fund is Brown Advisory Flexible Equity (MUTF: BIAFX ). This is a very low-turnover fund with a stable of great growth companies, a near 7% cash cushion and less than 1% expenses. BIAFX has not kept pace with the S&P since the 2007 crash, preferring to stick with rock-solid quality rather than chase the more-profitable biotech, social networking, etc. companies that have powered the current market. But for a downturn and recovery? I’ll take these 25 holdings over just about any other 25 I can think of. Next are two small-cap funds. Our discipline demands that we keep a percentage of our funds in small cap value, but that is the segment that has really had the best run over the past few years. What to do? In our case, we have decided to stick with small cap value but to do so in a hedged manner. We have selected two mutual funds that have large cash cushions because they are disciplined enough to buy only when they can find real value and not just because they are “missing out” on something. The most extreme example of this is a fund Morningstar gives only a single star, its lowest rating, to: Intrepid Small Cap (MUTF: ICMAX ). That’s because Intrepid’s current cash position is 74%. Yes, you heard right – 74%. Like me, they are having real trouble finding stocks to buy that actually fit inside the envelope of small cap “value.” Rather than do as so many other fund managers have done – drifted into a different more volatile style box – when ICMAX sells a winner and can’t find a replacement, they choose to stay in cash. This has not harmed their performance. They have soundly thrashed both the S&P 500 and the Small Cap Value benchmarks over the past 10 years. What it has harmed is their assets under management as short-sighted buyers declare, “I’m not paying you to hold cash.” That is so untrue! Sometimes cash is king. Sometimes you want to hold a cushion against an untoward event. And if your niche is small cap value and there is no value to be found, then cash for some hopefully short period of time is a very smart place to be. Especially if, via smart stock selection, you make more money than others using just 26% of your portfolio… Morningstar is kinder to Teton Westwood Mighty Mites AAA (MUTF: WEMMX ), awarding it 4 stars for similarly brilliant performance over time. WEMMX holds only 22% in cash, but they follow an equally strict discipline. As they sell more of their holdings, I expect to see their cash holdings increase as well, although they declare themselves to be a “small cap blend” (value as well as growth) fund. I like the holdings of WEMMX even more than ICMAX and I like the discipline they both bring to investing. ————— As Registered Investment Advisors, we believe it is essential to advise that we do not know your personal financial situation, so the information contained in this communiqué represents the opinions of the staff of Stanford Wealth Management, and should not be construed as “personalized” investment advice. Past performance is no guarantee of future results, rather an obvious statement but clearly too often unheeded judging by the number of investors who buy the current #1 mutual fund one year only to watch it plummet the following year. We encourage you to do your own due diligence on issues we discuss to see if they might be of value in your own investing. We take our responsibility to offer intelligent commentary seriously, but it should not be assumed that investing in any securities we are investing in will always be profitable. We do our best to get it right, and we “eat our own cooking,” but we could be wrong, hence our full disclosure as to whether we own or are buying the investments we write about. Disclosure: I am/we are long WEMMX, ICMAX, BIAFX. (More…) I wrote this article myself, and it expresses my own opinions. I am not receiving compensation for it. I have no business relationship with any company whose stock is mentioned in this article.