Tag Archives: applicationtime

Book Review: Quantitative Value

Wesley Gray, manager of the ValueShares US Quantitative Value ETF (BATS: QVAL ), may very well be the most interesting quant you’ll ever meet. Granted, the word “quant” brings to mind an old man in a white lab coat stooped over reams of data, but hear me out. Before getting his PhD in finance from the University of Chicago, Gray did four years of service as an active-duty U.S. Marine Corps ground intelligence officer in Iraq and other posts throughout Asia. Quantitative Value isn’t even his first book. That distinction goes to Embedded: A Marine Corps Adviser Inside the Iraqi Army . It’s hard to imagine the average fund manager crawling through the muck and gathering intelligence in Iraqi Arabic. But that is Dr. Gray, and his work is far from average. Quantitative Value , co-written by Gray and Tobias Carlisle, is a solid piece of research that combines the successful value investing framework of Benjamin Graham and Warren Buffett with the analytical rigor seen in Jim O’Shaughnessy’s What Works on Wall Street and Joel Greenblatt ‘s The Little Book that Beats the Market . In fact, Gray and Carlisle write extensively about Greenblatt’s “Magic Formula” and much of the book is an attempt to build the proverbial better mousetrap. We’ll take a look at some of Gray and Carlisle’s methods and then see how they perform in the real world by tracking the returns of the Quantitative Value ETF. The Quantitative Value screening process for stocks resembles a funnel: Step 1: Avoid Stocks That Can Cause a Permanent Loss of Capital This is a more elegant version of Warren Buffett’s first rule of investing: Don’t lose money. In first screening for risky stocks, Gray and Carlisle use some of the same metrics used by short seller John Del Vecchio to identify short candidates, such as days sales outstanding. They also give special attention to accrual accounting in the hopes of weeding out earnings manipulators and run additional screens for probability of financial distress. By removing the riskiest stocks from the pool at the beginning, Gray and Carlisle are a lot less likely to get sucked into a value trap. Step 2: Find the Cheapest Stocks Gray and Carlisle do extensive back testing on virtually every valuation metric under the sun, including industry standards such as price/earnings (“P/E”), price/sales (“P/S”) and price/book value (“P/B”). In the end, they opt to use the same valuation metric as Greenblatt in his Magic Formula: the Earnings Yield, defined here as earnings before interest and taxes (“EBIT”) divided by enterprise value. For those unfamiliar with the term, “enterprise value” is defined here as market cap (including preferred stock) + value of net debt, or what you might think of as the acquisition price of the company. Gray and Carlisle find that of all the assorted valuation metrics, the Earnings Yield yields the best results. Step 3: Find Highest-Quality Stocks This is another nod to both Buffett and Greenblatt. Buffett has repeated often that it is better to buy a wonderful business at a fair price than a fair business at a wonderful price, and Greenblatt tried to capture this mathematically by screening for companies that generated high returns on capital (“ROC”). Gray and Carlisle take it a step further by using an 8-year ROC figure. And they don’t stop there. Gray and Carlisle run additional screens for profitability and combine the metrics into a Franchise Power score. And taking it yet another step, they combine Franchise Power with Financial Strength to form a composite Quality score. Again, the objective here is to capture mathematically what makes intuitive sense: That companies with wide competitive moats, strong brands and strong balance sheets make superior long-term investments. So, how does the Quantitative Value model actually perform? In back-tested returns, it crushed the market. From 1974 to 2011, Quantitative Value generated compounded annual returns of 17.68% to the S&P 500’s 10.46%. Of course, we should always take back-tested returns with a large grain of salt. For a better comparison, let’s see how the Quantitative Value ETF has performed in the wild. We don’t have a lot of data to work with, as QVAL only started trading in late October 2014. But over its short life, QVAL is modestly beating the S&P 500’s price returns, 9.96% vs. 9.15%. As recently as April, it was beating the S&P 500 by a cumulative 4%. Looking at the returns of a substantially-similar managed account program managed by Gray’s firm, the “real world” results look solid. From November 2012 to May 2015, the Quantitative Value strategy generated compounded annual returns of 21.1% vs. the 18.3% return of the S&P 500. The Quantitative Value strategy was modestly more volatile (beta of 1.2) and had slightly larger maximum drawdowns (-6.0% vs. -4.4%). But this is exactly what you would expect from a concentrated portfolio. I look forward to seeing how QVAL performs over time, and I congratulate Gray and Carlisle on a book well written. Note: When referring to the book, “Quantitative Value” is italicized. When referring to the ETF or to the broader strategy, it is not. Original post Disclaimer: This article is for informational purposes only and should not be considered specific investment advice or as a solicitation to buy or sell any securities. Sizemore Capital personnel and clients will often have an interest in the securities mentioned. There is risk in any investment in traded securities, and all Sizemore Capital investment strategies have the possibility of loss. Past performance is no guarantee of future results.
MDY’s 2015 2nd-Quarter Performance And Seasonality

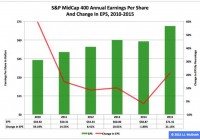
Summary The SPDR S&P MidCap 400 ETF in the first half ranked No. 1 among the three most popular exchange-traded funds based on the S&P Composite 1500’s constituent indexes. In the second quarter, the ETF’s adjusted closing daily share price dipped by -1.12 percent. And in June, the fund’s share price dropped by -1.28 percent. The SPDR S&P MidCap 400 ETF (NYSEARCA: MDY ) during 2015’s first half was first by return among the three most popular ETFs based on the S&P Composite 1500’s constituent indexes: It expanded to $273.24 from $262.52, an increase of $10.72, or 4.08 percent. Over the same period, MDY behaved better than the iShares Core S&P Small-Cap ETF (NYSEARCA: IJR ) by 6 basis points and the SPDR S&P 500 ETF (NYSEARCA: SPY ) by 2.91 percentage points. In contrast, MDY last quarter performed worse than SPY and IJR by -1.34 and -1.29 percentage points, in that order. Most recently, MDY last month lagged IJR by -2.34 percentage points and led SPY by 73 basis points. Comparisons of changes by percentages in SPY, MDY, IJR, the small-capitalization iShares Russell 2000 ETF (NYSEARCA: IWM ) and the large-cap PowerShares QQQ (NASDAQ: QQQ ) during the first half, over Q2 and in June can be found in charts published in “SPY’s 2015 2nd-Quarter Performance And Seasonality.” Figure 1: S&P 400 EPS , 2010-2014 Actual And 2015 Projected (click to enlarge) Notes: (1) Estimates are employed for the 2015 data. (2) The EPS scale is on the left, and the change-in-EPS scale is on the right. Source: This J.J.’s Risky Business chart is based on analyses of data in the S&P 500 Earnings and Estimate Report released June 30. MDY may have behaved OK in the first half, but the ETF might have a hard time performing OK in the second half. As Howard Silverblatt, senior index analyst at S&P Dow Jones Indices, indicated in the S&P 500 Earnings and Estimate Report series this year, the analysts’ average earnings-per-share estimate for the S&P 400 index underlying MDY for 2015 slipped to $71.31 June 30 from $75.06 March 26 (Figure 1). And I believe this EPS estimate continues to be highly unrealistic, as it would require growth of 21.13 percent over last year. As a result, I think there will be more downward revisions in this estimate, which collectively will not constitute an MDY tailwind. Figure 2: MDY Monthly Change, 2015 Vs. 1996-2014 Mean (click to enlarge) Source: This J.J.’s Risky Business chart is based on analyses of adjusted closing monthly share prices at Yahoo Finance . MDY behaved worse in the first half of this year than it did during the comparable periods in its initial 19 full years of existence based on the monthly means calculated by employing data associated with that historical time frame (Figure 2). The same data set shows the average year’s strongest quarter was the fourth, with an absolutely large positive return, and its weakest quarter was the third, with an absolutely small negative return. Figure 3: MDY Monthly Change, 2015 Vs. 1996-2014 Median (click to enlarge) Source: This J.J.’s Risky Business chart is based on analyses of adjusted closing monthly share prices at Yahoo Finance. MDY also performed worse in the first half of this year than it did during the comparable periods in its initial 19 full years of existence based on the monthly medians calculated by using data associated with that historical time frame (Figure 3). The same data set shows the average year’s strongest quarter was the fourth, with an absolutely large positive return, and its weakest quarter was the third, with an absolutely small negative return. Disclaimer: The opinions expressed herein by the author do not constitute an investment recommendation, and they are unsuitable for employment in the making of investment decisions. The opinions expressed herein address only certain aspects of potential investment in any securities and cannot substitute for comprehensive investment analysis. The opinions expressed herein are based on an incomplete set of information, illustrative in nature, and limited in scope. In addition, the opinions expressed herein reflect the author’s best judgment as of the date of publication, and they are subject to change without notice. Disclosure: I/we have no positions in any stocks mentioned, and no plans to initiate any positions within the next 72 hours. (More…) I wrote this article myself, and it expresses my own opinions. I am not receiving compensation for it (other than from Seeking Alpha). I have no business relationship with any company whose stock is mentioned in this article.

Exelon Cements Credentials As A Long-Term Stock

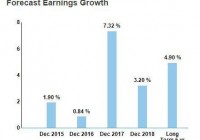
Summary Growth investments directed at improving generational assets and growing regulated asset base will ensure rate base growth and earnings stability for the company in the long run. Recent POM acquisition approval is signaling that EXC’s regulated EPS growth will improve in coming quarters. Future cash flows remain strong due to EXC’s efforts to have a large, regulated asset base. I reiterate my bullish stance on Exelon Corporation (NYSE: EXC ); the company is making good progress on its plan to have an extended regulated asset base through acquisitions and investments. EXC’s ongoing capital investments in several infrastructure development projects will add value to shareholder wealth, which will portend well for the stock price. Moreover, the company’s nuclear operation divesture plan is still under consideration; the plan, if approved, will strengthen EXC’s competitive position in the long run. The company’s rapidly growing regulated asset base provides a foundation for stable earnings and cash flow base, which will support dividend growth in future years. EXC currently offers an attractive dividend yield of 3.9%. Attractive Long-Term Growth Path Since the start of 2015, the volatile interest rate environment has weighed on utility stocks, and the utility sector underperformed the broad market in 1H’15. Owing to improving economic conditions in the U.S., the Fed is likely to increase short-term interest rates in 2H’15, which will put pressure on the stock prices of utility companies, including EXC. Despite the fear of a rise in interest rates, I believe EXC’s performance in the coming quarters will stay strong, mainly supported by the correct strategic efforts of the company. EXC, along with other utility companies in the industry, including American Electric Power (NYSE: AEP ) and PPL Corp. (NYSE: PPL ), have a robust capital spending outlook, which will support earnings growth in the next five years. EXC is following the industry norm by making hefty growth investments and acquisitions in regulated business to secure its long-term growth. During 2014, EXC spent almost $1.78 billion on several infrastructural growth-related projects, up 46.6% year-over-year. As per its recent sustainability report, the company has invested around $3.1 billion for electric and gas utility infrastructure, which includes a $500 million investment in the installation of smart meter technology during 2015. I believe the company’s recent approach to provide safe and reliable energy is bringing convenience for customers in a way that creates value for it over the long term. Another important area of investment has been EXC’s increased focus on improving its power generation capacity through the expansion and improvement of the gas business. In this regard, the company’s previously acquired 6 natural gas power plants in Maryland have started operations from June 28. The 128MW power plants will benefit EXC by improving its natural gas production capacity in the Maryland state and will ultimately add towards its rate base growth and positively affect the stock price. Moreover, the company has recently received approval for the much-awaited PEPCO Holdings (NYSE: POM ) merger from the Delaware Public Service Commission (PSC); the $6.8 billion merger is expected to complete in 2H’15, which will strengthen the company’s regulated operations and will positively affect the stock price. The upside of this merger rests in improving the EXC business and financial risk profile, as its regulated operations will increase; the company’s management expects that the merger will add nearly 15 cents-to-20 cents to EXC’s EPS during the first full year of operation. In fact, a rate base of nearly $26 billion has been projected for the combined entity, which indicates significant upside for its future ROE and cash flows. Moving ahead, under its plan of making strategic investments in diversifying the power generation portfolio, the company is planning to spend around $16 billion over the next five years, which I believe will enhance EXC’s future financial performance. On the other side, the company’s plan to shut down its loss making, Illinois-based 6 out of 11 nuclear power plants is still on hold. Recently, five of these nuclear units have failed to clear PJM’s base residual auction; despite the inability of its nuclear units to qualify for the PJM rate base auction, analysts are hoping that EXC will generate $150 million more in capacity revenue during 2017-2018 than it would have attained if all of its capacity had cleared the auction. However, the failure to qualify for the PJM auction has strengthened the company’s case before legislatures to shut down the nuclear plants. So, either the FERC should support them or LCPS standards should be changed to support its nuclear operations. While EXC is still in talks with the FERC to lower LCPS standards, I continue to believe that the closure of nuclear power plants is positively affecting the company’s performance in the long term, and will allow the company to focus more on stable regulated operations. EXC has an attractive dividend payment plan, which is strongly backed by its healthy cash flow base. Thus far, its healthy dividend payments have earned the company a decent dividend yield of 3.9% and a modest payout ratio of 48% , which indicates that there is significant room left for further dividend hikes, if the company opts to increase the payout ratio. Given EXC’s strong commitment to having a large, regulated asset base, I continue to believe in the security and sustainability of EXC’s future cash flow base, which ensures dividend stability and dividend growth in the years ahead. I recommend investors to keep track of the upcoming 2Q’15 earnings, as the company will provide an update on its capital expenditure outlook and will discuss its plans to increase regulated operations, which could have a significant impact on the stock price. According to the company’s guidance, EXC is expected to report EPS in a range of $0.45-$0.55 for Q2’15. In contrast, analysts are anticipating EPS of $0.51 for 2Q’15. The following table shows analysts; EPS forecast for EXC’s 2Q’15. Consensus EPS Forecast Low EPS Forecast High EPS Forecast 2Q’15 $0.51 $0.48 $0.55 Source: Nasdaq.com Risks The company continues to face operational and financial risk from its nuclear energy generation assets. Moreover, uncertainty about regulatory rate approvals, changes in national energy demand, stringent environmental standards and unforeseen negative economic changes are key risks that might hamper EXC’s future stock price performance. Conclusion I am bullish on EXC and believe the company will deliver a healthy performance in the long term. The company’s growth investments directed at improving its generational assets and growing its regulated asset base will ensure rate base growth and earnings stability in the long run. Furthermore, the recent POM acquisition approval is signaling that EXC’s regulated EPS growth will improve in the coming quarters. Moreover, the company’s future cash flows remain strong due to its efforts to have a large, regulated asset base, which will support dividend growth and make dividends more stable. Analysts have also projected a healthy next five-years earnings growth of 4.9% for EXC, as shown below in the chart. Source: Nasdaq.com Disclosure: I/we have no positions in any stocks mentioned, and no plans to initiate any positions within the next 72 hours. (More…) I wrote this article myself, and it expresses my own opinions. I am not receiving compensation for it (other than from Seeking Alpha). I have no business relationship with any company whose stock is mentioned in this article.