Tag Archives: applicationtime

Zweig Fund – Solid Equity Fund Available At A Discount

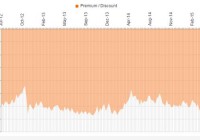
Summary Selling at a 13% discount to net asset value. ZF uses a GARP approach and has a managed distribution of 6% of NAV. Share buyback program adds alpha. The Zweig Fund (NYSE: ZF ) is an unleveraged U.S. equity closed-end fund that uses the “Growth at a Reasonable Price” or GARP approach. It invests mainly in large cap stocks that pay dividends. The Fund management adopts a top-down approach using econometric analysis of each sector, followed by a detailed review of securities at an industry group level. Fundamental analysis is then used to look for securities that offer superior total return opportunities. The fund is currently fully invested in equities, but cash allocations may be used at times based on asset allocation decisions of the fund managers. Dr. Marty Zweig, who passed away in 2013, was the fund’s creator. Marty was one of my favorite guests on the old Wall Street Week show with Lou Rukeyser. Marty always seemed nervous about market conditions on the show, but he was exceptionally disturbed on Friday, October 16, 1987 when he accurately called the stock market crash of 1987 which occurred the following Monday. Zweig created a large body of statistical market research, including the put/call ratio and other investment sentiment measures. The Zweig Fund still uses some of Marty’s research today to determine asset allocations. The current portfolio managers, Carlton Neel and David Dickerson, have managed the fund since 2003, and worked with Dr. Zweig for more than 17 years. ZF uses a 6% Distribution Policy where they pay out 6% of average net asset value every year. The Fund has a long history and was created in 1986. Over the Fund’s long history, there have been some variations in the discount or premium to NAV which has ranged from a 20% discount to a 20% premium. But over the last three years, the variation has been narrower, and the discount normally varies between -9% and -13%. (click to enlarge) Share Repurchase Program Last year, ZF extended a share repurchase program that allows the fund to repurchase up to an additional 10% of its shares outstanding. This program is intended to narrow the discount to NAV, and allows the fund to acquire its shares in the open market when they are trading at a discount. The share repurchase program is highly beneficial even when it doesn’t immediately narrow the discount, since it is accretive to NAV and adds some “alpha” to the fund’s performance. You add the annual managed distributions to the share repurchases to get the total amount of assets returned to shareholders at NAV. The fund started its buyback of shares on April 13, 2012. In 2013, they repurchased 1,403,553 shares at an average price of $13.76. In 2014, they repurchased 388,500 shares at an average price of $14.89. As of December 31, 2014, there were 1,860,041 shares remaining (representing 9.1% of the Fund’s shares then outstanding) that are authorized to be purchased under the repurchase plan in the future. (Data below is sourced from the Zweig Fund website unless otherwise stated.) Top Ten Holdings (as of March 31,2015) Macy’s Inc. (NYSE: M ) 2.16% MasterCard Inc. (NYSE: MA ) 2.14% Trinity Industries (NYSE: TRN ) 2.13% Royal Caribbean Cruises, Ltd. (NYSE: RCL ) 2.12% Abbott Labs (NYSE: ABT ) 2.10% Valero Energy (NYSE: VLO ) 2.09% Biogen Idec (NASDAQ: BIIB ) 2.04% BB&T Corp. (NYSE: BBT ) 2.03% Facebook (NASDAQ: FB ) 2.01% HCA Holdings (NYSE: HCA ) 2.01% Equity Sector Allocation % Fund Information Technology 18.02 Industrials 17.26 Healthcare 16.62 Consumer Discretionary 16.45 Financials 13.09 Energy 7.85 Materials 4.23 Consumer Staples 3.74 Telecommunication services 1.79 Ticker: ZF Zweig Fund pays quarterly Total Net Assets= 345 Million Total Common Assets= 345 Million Quarterly Distribution= $0.253 Annual Distribution= $1.012 Annual Distribution Yield= 6.87% Fund Expense ratio= 1.16% Discount to NAV= -12.80% Number of Holdings= 56 Portfolio Turnover rate= 6% Leverage= None There may be a good medium-term trading opportunity in ZF right now. Over the last year, the average discount to NAV has been -11.7%. The 1-year discount Z-score is -1.63, which means that the discount to NAV is almost two standard deviations below the average. Source: cefanalyzer ZF is only moderately liquid, and some care must be taken to acquire a large position. Yahoo Finance lists an average daily trading volume of 46,000 shares, which is equivalent to $680,000. The bid-asked spread is usually one or two cents, but there is often only limited size available. Disclosure: I am/we are long ZF. (More…) I wrote this article myself, and it expresses my own opinions. I am not receiving compensation for it (other than from Seeking Alpha). I have no business relationship with any company whose stock is mentioned in this article.
Separation Of Volatile Merchant Business Will Lead American Electric Power To Outperform

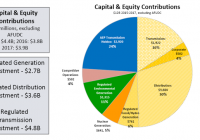
Summary Separation of volatile merchant business will lead to multiple expansion. Higher capex spend to support growth in the weaker environment. Transmission business is expected to be a significant contributor to AEP’s growth in the near future. Healthy balance sheet to trigger M&A opportunities for AEP. Above industry average dividend growth with room for growth may support stock in low power pricing environment. Company description American Electric Power (NYSE: AEP ) is one of the largest electric utilities in the United States (US), delivering electricity to more than 5.3m customers in 11 states. AEP ranks among the nation’s largest generators of electricity, owning nearly 38,000MWs of generating capacity in the US. AEP also owns the nation’s largest electricity transmission system, a more than 40,000-mile network that includes more 765-KV extra-high voltage transmission lines than all other US transmission systems combined. Investment highlights Separation of merchant generation business to improve multiples I expect AEP to sell/spin off its volatile merchant generation business later this year. The company’s management has already confirmed its commitment to make the company a pure regulated utilities business. I see the separation of merchant generation business as a positive catalyst in two ways: 1) AEP as a pure regulated utilities company commands higher multiple and 2) the current stock price doesn’t reflect the merchant generation business. At current levels, AEP trades in line with Duke Energy Corporation (NYSE: DUK ) (15.5x FY15 EPS) excluding any value for its merchant generation business (DUK has already sold its merchant generation business to Dynergy for $2.8bn). Unlike DUK, AEP has no exposure to international risk so commands higher multiple. High capex to support growth Over the next 3 years, AEP plans to invest $12bn (96% to regulated businesses), with nearly $5bn in transmission, $3.6bn in regulated distribution, and $2.7bn into its regulated generation fleet. This drives a 6.6% rate base CAGR across the regulated businesses (including transmission) for 2015-2017. The rate base growth combined with cost cutting measures will definitely help the company reach the target EPS growth of 4%-6% annually. AEP’s future capex plan: (click to enlarge) Source: June 2015 Investor presentation of AEP Transmission business to be a significant contributor to growth I believe the company’s 4%-6% EPS growth rate target is quite achievable and the transmission business is going to be the main contributor to growth, providing $0.15/yr of EPS growth through 2018. With management focused on capital allocation for its businesses, i expect transmission to get the incremental investment from any sale proceeds (sale proceeds from merchant business). AEP’s Transmission Business revenue growth estimate: (click to enlarge) Source: June 2015 Investor presentation of AEP Strong balance sheet AEP is safely levered at present, given regulatory requirements at most of its utility subsidiaries and covenants that require AEP to maintain debt/total capitalization at a level that does not exceed 67.5%. Going forward, i expect the company to remain in safer zone due to stable cash flows from the regulated business. Total debt/capital was 54.4% as of year-end 2014 and i expect it to remain relatively constant going forward despite high investment plans. In addition, AEP has ample liquidity with $163m of cash and $3.5bn of borrowing capacity under its credit facility commitments as of year-end 2014. I view AEP’s dividend as safe and expect the dividend payout ratio to remain at 60%-70%. Source: June 2015 Investor presentation of AEP Experienced management Nick Akins, the sixth CEO in AEP’s 100-year history, became the CEO in 2011. Before his promotion, Mr. Akins served as the executive VP of AEP’s generation unit. He has also led the company’s Southwestern Electric Power unit and was vice president of energy marketing services in his 30 years with the company. Brian Tierney, the executive VP and CFO, has been with AEP since 1998. The experienced management will definitely focus on growing regulated business post separation from volatile merchant business. Strong dividend growth During the 12 months ending 3/31/2015, AEP paid dividends totaling $2.09/share. Since the stock is currently trading at $54.23, this implies a dividend yield of 3.9% (higher than NextEra Energy Inc , AES Corp , NRG Energy, Inc., which have a current dividend yield between 2.3% and 2.9%). AEP has increased its dividend during each of the past 5 years (in 2009, the dividends were $1.64/share). The company has a payout ratio of 60.1% which is expected to reach 70% going forward. AEP’s dividend history and estimate Source: June 2015 Investor presentation of AEP Valuation My price target of $61.26 for AEP is based on a 3.2% premium to the industry target average P/E multiple of 15.5x on 2016 EPS estimate of $3.60. I assign the premium to reflect an improved regulatory environment in most of AEP’s service areas, a visible long-term earnings growth profile in its transmission segment, expected sale of merchant generation business , as well as benefit from PJM’s Capacity Performance proposal. I recommend investors to take position in AEP at current level of $54.23 to get a return of 16.7% (13% price appreciation+3.7% of dividend yield) in one year. AEP’s Regulated Business FY16 Adj EPS P/E multiple Price/share Utilities $2.82 15.8x $44.42 Transmission $0.74 16.8x $12.40 Other $0.04 15.8x $0.63 Total Equity/share $3.60 16.0x $57.44 AEP’s Competitive Gen. Business FY16 Adj EBITDA, $m EV/EBITDA Multiple   Generation co. 360 8.0x 2,880 Debt, $m     1,006 Equity value, $m     1,874 Number of shares, m     490 Equity/share     $3.82         Total Equity/share     $61.26 Current trading price     $54.23 Upside     13.0% Disclosure: I/we have no positions in any stocks mentioned, and no plans to initiate any positions within the next 72 hours. (More…) I wrote this article myself, and it expresses my own opinions. I am not receiving compensation for it (other than from Seeking Alpha). I have no business relationship with any company whose stock is mentioned in this article.
Futures Pits Shuttered But Trading Goes On

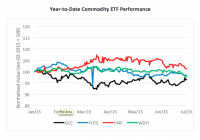
Why? To acknowledge the passing of a great tradition. This is “lights out” week for futures pit trading. As of Monday, all but the S&P 500 futures pit are to be shuttered by CME Group (commodity options pit trading will, however, survive). Futures aren’t going away, so worry not you holders of commodity ETFs; trading’s just going to be screen-based now. Well, truth be told, it’s been screen-based. Open-outcry trading has been dying for years as more and more business moved “upstairs.” At last look, pit trades represented only one percent of total futures volume. So, you can still buy futures-based funds and notes. That is, if you’re interested. There are 148 exchange-traded commodity products extant, ranging from broad-based long-only trackers to levered and inverse single-commodity items. Admittedly, long-only hasn’t been a very good play recently. Witness the GreenHaven Continuous Commodity Index ETF (NYSEARCA: GCC ), an index tracker representing 17 equally weighted commodities, which is off more than 3 ½ percent for the year. The beauty of futures, of course, is the ease of going short when appropriate. Margins are the same for sellers and buyers alike. Investors in managed futures ETFs have the potential to hold a diverse portfolio of short and long commodity positions. This year, managed futures ETFs have outperformed passive long-only trackers by varying degrees. Only one, though, has managed to churn out a positive return. The First Trust Morningstar Managed Futures Strategy ETF (NYSEARCA: FMF ) is up better than one percent in 2015 – not a great gain, mind you, but certainly better than its peers. Both the ProShares Managed Futures Strategy ETF (FUTS ) and the WisdomTree Managed Futures Strategy ETF (NYSEARCA: WDTI ) are currently under water. So what sets FMF apart? A hefty dollop of S&P 500 Index contracts for one thing. Both FUTS and WDTI eschew equity futures. Knowing this, potential users need to consider the utility of adding additional equity exposure to their portfolios, at least as long as FMF holds on to its S&P allocation. Oh, there’s one other thing to consider. Now that the pits are dark, where’s CNBC’s Rick Santelli cheering section going to be stationed? Brad Zigler is REP./WealthManagement’s Alternative Investments Editor. Previously, he was the head of marketing, research and education for the Pacific Exchange’s (now NYSE Arca) option market and the iShares complex of exchange traded funds.