Tag Archives: applicationtime

While The Athens Exchange Is Closed, The Greece ETF Show Goes On

Investors can still trade Greece through an ETF while Athens Stock Exchange was closed. GREK showing larger discount to net asset value. Investors should understand risks of ETFs that track international markets. Exchange traded funds try to reflect the performance of an underlying market. However, there are times when an ETF may diverge from the net asset value, especially with international markets. For example, the Global X FTSE Greece 20 ETF (NYSEArca: GREK ) is was trading at a 10.4% discount to its NAV on Monday, according to Morningstar data. GREK plunged 8.9% Monday on over four times its average daily volume after Greece rejected austerity measures demanded by international creditors in a referendum vote over the weekend. The Greece ETF has been swinging in volatile trading over the past week . ETFs, more or less, consistently reflect the movement of their net asset value, or combined value of all securities in an ETF’s portfolio divided by the number of ETF shares outstanding, as market makers or authorized participants create or redeem ETF shares by buying or selling baskets of underlying securities for ETFs. Since ETFs trade like any other stock on an exchange, the ETF’s price can fluctuate throughout the day. ETFs typically update their underlying trading value, calculating the approximate NAV every 15 seconds throughout the trading day. In domestic equity ETFs, the NAV works as intended. The NAV provides a fair value of the ETF, which basically means the fund is trading in line with its underlying assets with little or no tracking error. This also allows investors to get a better view of whether or not they are over or underpaying an ETF. When the ETF’s price is lower than the NAV , the ETF is said to be at a “discount” – the ETF is valued less than the fund’s overall holdings. If the ETF’s price is above the NAV, the ETF is said to trade at a “premium” – the ETF is trading higher than what the underlying holdings are worth. However, the NAV gets cloudier when looking into other markets. For instance, international markets are not open in the same time zone as U.S. markets, but foreign stock and bond ETFs are still trading on U.S. exchanges. Since the NAV is taken based on the last price at which it was traded, the NAV may not move during normal hours. Consequently, the NAV for international ETFs, along with most commodity and fixed-income funds, may represent a stale number as these markets don’t necessarily trade during normal U.S. market hours. In the case of Greece, the Athens Stock Exchange has been closed for at least a week, following the June 28 decision by the Systemic Stability Council for a week-long closure of the country’s banks and local stock market, according to ekathimerini . The Greek bourse remains closed Monday. Consequently, the traded value of GREK has deviated considerably from its NAV – the ETF is currently trading at a much lower value to its constituents due to the underlying market closure. The last time something similar occurred was during the so-called Arab Spring of 2011 when Egyptian markets were shut down for two months, but U.S. investors were still able to trade shares of the Market Vectors Egypt Index ETF (NYSEArca: EGPT ) . Nevertheless, GREK ETF investors may still get a general sense of where the ETF is going through indirect means. For instance, Coca-Cola HBC, which makes up 21.4% of GREK, dipped 3.9% over the past week while the National Bank of Greece (NYSE: NBG ), which makes up 9.5% of GREK, saw the value of its American Depository Receipts pare recent gains to fall flat for the week. Max Chen contributed to this article . Disclosure: I/we have no positions in any stocks mentioned, and no plans to initiate any positions within the next 72 hours. (More…) I wrote this article myself, and it expresses my own opinions. I am not receiving compensation for it. I have no business relationship with any company whose stock is mentioned in this article.
UNG Remains Range-Bound

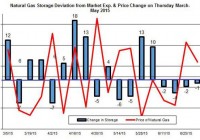
Summary The injection to storage was 69 Bcf – close to market expectations. The price of UNG bounced back. The demand for natural gas in the power sector could climb back up on account of warmer weather. The oil and natural gas market remained range-bound in recent weeks. The price of United States Natural Gas (NYSEARCA: UNG ) bounced back last week, even though the injection to storage was close to market expectations and the weather — while it keeps heating up in many parts in the U.S. — hasn’t driven up the demand for natural gas in the power sector. Moreover, the price of UNG remained range-bound for recent weeks. Will the warmer weather start to heart up the natural gas market? According to the latest EIA report , the injection to storage was 69 Bcf, which wasn’t far off market estimates. Over the next few weeks the market estimates the injections to storage will be higher than normal — on average over 85 Bcf per week, while the five-year average is around 65 Bcf. The higher injection could be driven by higher production and even more so by softer demand. But is the demand expected to cool down? As of last week, the natural gas market has cooled down. The demand for natural gas changed course and slipped by 3.2% week over week. Most of this fall came from softer demand in the power sector. Even though other sectors — including industrial and residential/commercial — also saw a decline in consumption. As of last week, total consumption is up by 4.6% year on year. That’s not far off of the current annual outlook growth in consumption. Despite the drop in demand for natural gas in the power sector, in the coming weeks the weather is projected to be much warmer than normal — mainly in the West and parts of the South Atlantic. Also, the cooling degree days (CDD) are estimated to be higher than normal by 9 degrees, and by 8 degrees compared to last year. The higher temperatures and CDD could suggest a rise in consumption in the power sector. How Will the Price of UNG React to the Storage Report? During the winter time, the price of natural gas tends to react to the news about the changes in storage. But during the summer the correlation tends to be weaker and has a smaller impact on the price of UNG. So far this injection season the price of natural gas seems partly correlated to the deviation from market expectations. (click to enlarge) Source: Data taken from the EIA. The natural gas output inched down by 0.2% last week, but it’s still up for the year by nearly 5%. Baker Hughes reported a decline of nine gas rigs to 219. Conversely, oil rigs have gone up by 12 during the previous week. But oil rigs are also down for the year. Finally, the movement in the oil market, which shouldn’t have an impact on natural gas prices, still seems to coincide to a certain extent, as presented in the chart below. The correlation between the two data sets is 0.24. (click to enlarge) Source: Data taken from the EIA. In both cases, energy prices have been range-bound as the market continues to figure out what’s next for the energy market, and if and when we will see a drop in the production of U.S. oil companies. So far, oil and gas companies have reduced the number operating rigs and slashed capex for 2015. But these measures have yet to cool down the U.S. oil and gas yield. The injection season still has a few more months to go, in which the injections to storage are still expected to be higher than normal. Nonetheless, the hotter-than-normal weather in the coming weeks could start again driving up the demand for natural gas in the power sector, which could bring the price of UNG back up. Or, at the very least, it could keep prices range-bound. (For more, please see ” Natural Gas Is Still Floating … Barely .”) Disclosure: I/we have no positions in any stocks mentioned, and no plans to initiate any positions within the next 72 hours. (More…) I wrote this article myself, and it expresses my own opinions. I am not receiving compensation for it (other than from Seeking Alpha). I have no business relationship with any company whose stock is mentioned in this article.

Investors Turn Away From Municipal Bond Mutual Funds

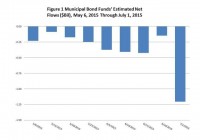
By Patrick Keon Municipal bond mutual funds have suffered nine consecutive weeks of net outflows. During this time period municipal bond fund have had approximately $3.3 billion leave their coffers. This streak of negative flows comes on the heels of sixteen straight months of positive flows during which time the group took in $31.9 billion in net new money. The lion’s share of the outflows (-$2.5 billion) during the last nine weeks have come from funds in Lipper’s national municipal fund classifications. Amongst those, high yield municipal debt funds (-$1.5 billion) and short-term municipal debt funds (-$0.5 billion) have experienced the largest negative flows. Some of the funds with the largest outflows over the last nine weeks include Nuveen High Yield Municipal Bond Fund ( NHMAX) (-$636 million), Invesco High Yield Municipal Fund (MUTF: ACTHX ) (-$178 million) and Oppenheimer Rochester High Yield Municipal Fund (MUTF: ORNAX ) (-$162 million). Over a third of the total net outflows (-$1.2 billion) for municipal bond flows occurred last week and once again high yield municipal debt funds were responsible for the largest chunk (-$0.47 billion) of the activity. It is possible that the Puerto Rico debt crisis may have been a factor in last week’s spike in outflows from high yield municipal debt funds as both the Oppenheimer Rochester High Yield Municipal Fund and Invesco High Yield Municipal Fund have significant holdings in Puerto Rico municipal debt. (click to enlarge) Share this article with a colleague