Tag Archives: applicationtime

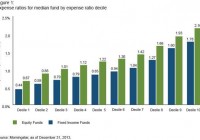
Don’t Overpay For An Epic Investing ‘Fail’

Summary Lowering the cost of actively managed funds is an important step in improving the odds of outperformance. Highly rated funds are not good predictors of future performance. Why a holistic approach with good judgment, including quantitative and qualitative elements is a “WIN!” By Chris Philips, CFA An investing “FAIL”? Pop culture and investing rarely cross paths. After all, pop culture is hip, exciting, and flashy. Conversely, we’ve seen that successful investing is generally anything but. Nevertheless, the last decade or so has seen the rise of an internet meme that may be applicable to the investing world-“FAIL.” So what are a “FAIL” and its illustrious cousin “epic FAIL”? Both are generally used to describe embarrassing events, such as setting your kitchen on fire as you film yourself attempting to light birthday candles (FAIL)-by using a blowtorch to be cool (epic FAIL). Now I hope none of us have burned down a house while reviewing an investment portfolio! So I can’t visualize an investing epic FAIL in this vein (although some may suggest that the global financial crisis would suffice), but there are at least three areas where I can confidently say FAIL: cost, ratings, and performance. The cost-value riddle First up is the issue of cost. People intuitively associate higher cost with value and performance. Unfortunately, it’s backwards. For example, see Figure 1, where I break out U.S. equity and fixed income funds into deciles according to their reported expense ratios. Cost and performance ARE related. However, the data show that the lower the cost, the better the experience (on average). You should pay more for performance? FAIL (click to enlarge) Relying on ratings Next is the question of industry ratings. The allure of something-anything-that could potentially help us do better by our clients is strong. Figure 2 illustrates this -investors have clearly favored higher-rated funds and shunned lower-rated funds. These patterns wouldn’t be noteworthy if 4- and 5-star-rated funds consistently added value. (Or perhaps they would be, if they revealed a metric that could reliably predict performance!) However, in the research underlying Figure 2, we showed that highly rated funds in one rating period tended to be the worst performers relative to a style benchmark over the next 3 years-underperforming on average by 138 basis points per year. Funds with 1-star ratings also underperformed, but at a much more modest rate of 15 basis points per year. You should stick to top-rated funds? FAIL Patience and performance Of course, some may dismiss the cash-flow example as “retail” investors chasing returns. However, there’s also evidence of return-chasing among institutional investors.[1] After all, we are all human, whether acting in a fiduciary capacity or on our own behalf. In an article published in The Journal of Finance , Amit Goyal and Sunil Wahal reported on the outcomes of hire/fire decisions across a broad sample of plan sponsors. They found that underperforming managers were (not surprisingly) replaced with managers who demonstrated significant outperformance (represented with blue bars in Figure 3). I say “not surprisingly,” because what fiduciary would want to keep an underperforming fund or asset on the books? However the twist is in what happened following the replacement. On average, those managers who were hired to replace the poor performers underperformed the same managers they replaced in the next 1-, 2-, and 3-year periods! In Figure 3, this record is shown by the green bars. You should systematically replace underperformers? FAIL Avoiding FAIL The moral of this story is that while ratings and cost should not be summarily dismissed, we should take a collective step back and think about what really matters when constructing portfolios or looking to provide clients with the best opportunity for success. Controlling costs is critical, to be sure. But equally important is a robust evaluation process that includes many variables for considering whether fund A, B, or C should be added, dropped, or ignored. Such a qualitative process can complement the quantitative metrics that have been shown to potentially lead us astray. A holistic approach with good judgment, including quantitative and qualitative elements? Now that’s a WIN! Footnotes Mark Grinblatt, Sheridan Titman, and Russ Wermers initiated the academic literature on return-chasing behavior among institutional investors in their paper “Momentum investment strategies, portfolio performance, and herding: A study of mutual fund behavior,” The American Economic Review , 85(5), 1995. Notes All investing is subject to risk, including the possible loss of the money you invest. Past performance does not guarantee future results.
Buying The Dip In Apple? You’re A Market Timer

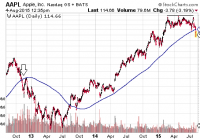
The last time Apple pulled back 10%-plus from its peak and fell below its 200-day trendline, the stock went on to lose 33% from that moment forward. In a market where the median U.S. stock sports its highest P/E and P/S ratios ever, Apple is a relative “bargain.” However, I am not particularly interested in writing about the merits of Apple as a buying opportunity. I am far more intrigued by discussing the hypocrisy of the buy-n-hold community. One of the media’s biggest financial stories this week involves the curious fall of Apple (NASDAQ: AAPL ). Specifically, the largest company in the world by market capitalization has entered correction territory – a 10%-plus fall from a high-water mark. Not surprisingly, few analysts have soured on shares of the culture changer. Even fewer are discussing the technical resistance near $133 per share let alone the drop below a 200-day moving average. The last time Apple pulled back 10%-plus from its peak and fell below its 200-day trendline, the stock went on to lose 33% from that moment forward. Obviously, history rarely repeats itself in identical fashion. What’s more, in a market where the median U.S. stock sports its highest P/E and P/S ratios ever, Apple is a relative “bargain.” Heck, Apple even offers an attractive dividend that you wouldn’t be able to count on from most companies in the white hot biotech space. On the other hand, I am not particularly interested in writing about the merits of Apple as a buying opportunity. On the contrary. I am far more intrigued by discussing the hypocrisy of the buy-n-hold community. In particular, “don’t try to time the market” pretenders are the first in line to discuss the benefits of buying Apple as it trades at a 10% price discount from its highs. If you’re a buyer of stock at a particular time at a specific price, you are timing the market. If you rebalance when you perceive your allocation is out of whack, you are a market timer as well. You are selling some assets at one price and buying other assets at another price. There’s also the hold-n-hope claim that one sticks to his/her asset allocation mix through thin and thick. If that is so, then where does the 60%-40% stock-bond asset allocator suddenly have more cash to buy more Apple shares? Retirees with rollovers sure wouldn’t have it from work income. Even for the buy-n-hold asset allocator who claims he would use the income from dividends and interest or “work” to buy more Apple is being disingenuous. If you have no intention of timing the market, all of the monies would be reinvested immediately; you would not be waiting for an opportunity. The whole idea of a buying opportunity is, by definition, a market timing endeavor. And yet, people only scream bloody murder about market timing when someone suggests selling assets . It does not matter if you adhere to fundamental rules (e.g., extreme overvaluation versus undervaluation) and technical trends (e.g., deteriorating breadth/market internals versus improving breadth/market internals). When the stock market is on a six-year bull run, anything that resembles risk reduction is regularly panned. My tactical asset allocation strategy for reducing exposure to riskier assets involves reducing (not eliminating) exposure to riskier assets when valuations are hitting extremes, technical internals are deteriorating and economic indicators are weakening. When valuations are fair, internals are improving and economic signs are strengthening, we raise exposure to riskier assets back to a client’s target mix. Market timing? Sure, in the same way that opportunistic rebalancing activity and opportunistic efforts to buy quality stocks like Apple at lower prices fit the bill. Indeed, the staunchest advocates of buying-n-holding, including the wonderfully talented Warren Buffett, have a plan for when and what to buy and when and what to sell. Mr. Buffett’s decision to sell all of his Exxon Mobil (NYSE: XOM ) shares in the wintertime demonstrated that there are opportunities to reduce perceived risks, just as others may view the acquisition of more Apple shares today as sensible risk. Just be honest, Mr. Buy-the-Apple-Dip Advocate. Your attempt to acquire shares of Apple at a 10% price discount today is an effort to time the market for when to acquire more of the stock. And more power to you! However, let’s imagine that I dared to opine that overall risks in the stock market are exorbitantly high. And that I put forward a notion that if Apple represented 15% of a portfolio, perhaps one might wish to reduce the exposure to 7.5%. (Remember, I am asking one to imagine this proposition.) Immediately, there would be calls for my “market timing” head. The mere suggestion of selling or rebalancing based on fundamental, economic and technical analysis would be deemed blasphemous. Not surprisingly, the loudest screams about the evils of market timing come during the height of bull market euphoria. Ironically, near the lowest ebb of bear market distress – whether it is with individual shares of Apple (10/2012-7/2013) or with broad market benchmarks like the S&P 500 (e.g., 2000-2002, 2007-2009, etc.), those screams turn to whimpers. The facts that I have been presenting for several months still remain. The U.S. economy has been showing signs of strain, regularly missing expectations and estimates. Corporate revenue has now declined year-over-year for two consecutive quarters, pushing valuations on stocks to higher extremes. Meanwhile, market breadth has shown no signs of recovering since May, when the S&P 500 Bullish Percentage Index straddled 75% (today closer to 50%) and the NYSE Advance Decline (A/D) Line hit its last peak. Disclosure: Gary Gordon, MS, CFP is the president of Pacific Park Financial, Inc., a Registered Investment Adviser with the SEC. Gary Gordon, Pacific Park Financial, Inc, and/or its clients may hold positions in the ETFs, mutual funds, and/or any investment asset mentioned above. The commentary does not constitute individualized investment advice. The opinions offered herein are not personalized recommendations to buy, sell or hold securities. At times, issuers of exchange-traded products compensate Pacific Park Financial, Inc. or its subsidiaries for advertising at the ETF Expert web site. ETF Expert content is created independently of any advertising relationships.

To Rebalance Or Not To Rebalance

By Larry Cao, CFA Rebalancing is a topic that most professional money managers are familiar with and yet it is hardly clear to many whether this is a practice that actually adds value. I recently spoke with Jason Hsu , co-founder and vice chairman of Research Affiliates, on the subject while he was visiting in Hong Kong. If you follow our conversation, it seems like there is ample room for improvement. For example, are the people who have the most to gain from rebalancing actively engaged in the practice? Equally important, are those who are actively rebalancing actually benefiting from the exercise? These are questions to which all professional money managers should have crystal clear answers formulated in their minds. Enterprising Investor: Rebalancing is a somewhat mundane topic but it is extremely relevant for practitioners. You have done research on the subject and you are also an investor. Do you think investors should rebalance? Jason Hsu: Statistically, there is documented intermediate-horizon mean reversion in equity returns and long-term mean reversion in asset class returns. A naïve but effective way to benefit from mean reversion is to make sure that you regularly rebalance against past price movements. A lot of people call this contrarian trading. The magnitude of this rebalancing benefit is directly related to the magnitude of mean reversion. Where there might be potential disagreement about the benefit of rebalancing, it is due in part to language and definition. Some people define the benefit of rebalancing more narrowly. So there are two levels of rebalancing. One is at the asset class level for multi-asset strategies: you rebalance an asset class to its target weight. The other one is within each individual asset class: you rebalance each holding to its target weight. Which is generally more beneficial? In terms of the benefit from rebalancing, it is larger when applied within an asset class. Two features work in your favor when applying contrarian rebalancing within asset classes: (1) shorter mean-reversion horizon and (2) a larger cross-section. Mean reversion is a very noisy signal, thus you really need a lot of securities to make the effect work reliably. When you aggregate the effect across hundreds of securities within an asset class, the law of large numbers kicks in to wash out the noise and accentuate the mean-reversion effect. When applying contrarian rebalancing across asset classes, if you don’t have many distinct asset classes, the benefit would be more lumpy. Additionally, since the asset class mean-reversion horizon is a bit longer, you might have to wait a bit for the effect to really kick in and work for you. I think the number of securities plays an important role, correct? Quant models may do a terrific job at picking stocks – for example, a model’s top five picks does better than the top 10, the top 50 does better than the top 100, etc. But if you look at individual buy and sell transactions, it’s harder to show that they actually add value. This is also why investors often question whether rebalancing adds value. That’s a point oftentimes lost to more casual investors, in part because they are used to more traditional concentrated stock-picking managers, who supposedly have deep insights on every stock. But when it’s more quantitative in nature, the manager’s edge for each stock is actually relatively small. Most quant strategies attempt to exploit return patterns related to some assumed behavioral biases. However, these statistical patterns apply only on average; you are never quite sure how it will work for a particular stock at a particular point in time. This is why quant portfolios need a large number of securities. Rebalancing is a simple quant strategy aimed at taking advantage of price mean reversion; as such it needs a large cross-section of securities or as Richard C. Grinold and Ronald N. Kahn refer to – breadth . The classic argument of rebalancing to, say, a 60/40 portfolio, is more troublesome. You only have two asset classes, so you don’t have the law of large numbers on your side. The asset class mean reversion also takes place over a much longer horizon. We are talking about a minimum of five years. So at that level, if you try to measure the rebalancing benefit, I’m not surprised that most wouldn’t find satisfying evidence. This is also related to the empirical observation that the Shiller CAPE ratio, which is a popular quantitative signal for implementing contrarian rebalancing, has worked better for rebalancing among a number of equity indices than for timing rebalancing from stocks to bonds. The case for rebalancing, especially in the multi-asset context, is often made with the assumption that you have complete foresight. Obviously, these return (and risk) forecasts are often very far off. I think the average user grossly overestimates the benefit of estimating the optimal portfolio weight. What they don’t realize is the dispersion of expected returns for stocks and asset classes is very small. So we frankly couldn’t tell whether a 5% weight to Apple (NASDAQ: AAPL ) is more optimal than a 1% weight with any degree of confidence. This enormous uncertainty suggests that the notion of “optimal portfolio weights” is not at all realistic and trading aggressively based on presumed optimal weights is probably not advisable. So you think investors can compensate for the fact that optimal weights are sensitive to return and risk facts by not taking these weights too seriously? How do investors rebalance in practice? I think a lot of investors employ the following approach: Every year or two, you reformulate your capital market assumptions to determine the right weights to rebalance to. Like we discussed before, the challenge is that if your expected returns are set incorrectly, you could be rebalancing to very bad target weights. It is almost worse than not rebalancing. This often involves using a portfolio optimizer to set the optimal weights. Case in point, if you thought the expected returns for equities and credits were going to be -10% for 2009 in response to the negative shocks from the global financial crisis, the portfolio optimizer would most certainly set 0% weights for these two asset classes. That wouldn’t have worked very well. Let me share with you a really interesting finding on naïve versus sophisticated asset allocation. Victor De Miguel, Lorenzo Garlappi, and Raman Uppal ran a horse race between naïve equal weighting and optimization-based investment strategies, where portfolio weights were optimized using a variety of models for expected returns. Note that the equally weighted portfolio essentially professes no understanding of expected returns and covariance for securities – it only captures mean-reversion. Surprisingly nothing beats equal weighting. So it really drives home the point that oftentimes people’s dissatisfaction with regularly rebalancing to target weights isn’t that somehow rebalancing your portfolio is a bad concept. The poor experience is largely driven by the fact that your desired target weights coming out of an optimizer were not very good to start with. In some ways, fear and greed (and perhaps hubris) can cause us to focus too much on shifting the portfolio weights (often counterproductively) and thus forgo or diminish the benefit of contrarian rebalancing to capture mean reversion. If most people can’t do it right, then isn’t rebalancing less interesting? There is another approach to rebalancing, what I like to call the lazy approach. It doesn’t really use advanced theory to forecast returns and then optimize. Essentially, investors start with a policy portfolio that isn’t concentrated in a handful of securities or asset classes. If you then regularly rebalance back to this starting static weight, you should do alright over time in terms of capturing the mean-reversion effect. I think for the average investor without special forecasting skill or who is more prone to overconfidence in her return estimates, this lazy approach to rebalancing probably works best. The lazy camp rules. Is there an optimal frequency for rebalancing? You really don’t want to overfit the data and say, “Okay, for large-cap US stocks, I rebalance every 11 months because it gives the best looking backtest.” Determining the optimal rebalancing frequency is most likely a data mining exercise that won’t produce useful out-of-sample performance. Heuristically, I think rebalancing once a year seems quite dependable; this helps you avoid a lot of the short-term momentum effect. Sounds like a good rule of thumb. After taking into account all these challenges investors face, what are some of the strategies that most benefited from rebalancing? I think it is useful to think of contrarian rebalancing as buying cheap after prices have fallen and then selling high after prices have rallied. In a way, it is a flavor of value investing. For markets where value investing has historically worked well, contrarian rebalancing also works well. For example, contrarian rebalancing works really well for Japanese stocks, small-cap stocks, and emerging market stocks, on average. Disclaimer: Please note that the content of this site should not be construed as investment advice, nor do the opinions expressed necessarily reflect the views of CFA Institute.