Tag Archives: applicationtime

How To Avoid The Worst Sector ETFs: Q2’15 In Review

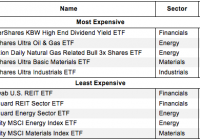
Summary The large number of ETFs has little to do with serving your best interests. Below are three red flags you can use to avoid the worst ETFs. The following presents the least and most expensive sector ETFs as well as the worst overall sector ETFs per our 2Q15 sector ratings. Question: Why are there so many ETFs? Answer: ETF providers tend to make lots of money on each ETF so they create more products to sell. The large number of ETFs has little to do with serving your best interests. Below are three red flags you can use to avoid the worst ETFs: 1. Inadequate Liquidity This issue is the easiest to avoid, and our advice is simple. Avoid all ETFs with less than $100 million in assets. Low levels of liquidity can lead to a discrepancy between the price of the ETF and the underlying value of the securities it holds. Plus, low asset levels tend to mean lower volume in the ETF and larger bid-ask spreads. 2. High Fees ETFs should be cheap, but not all of them are. The first step here is to know what is cheap and expensive. To ensure you are paying at or below average fees, invest only in ETFs with total annual costs below 0.54%, which is the average total annual cost of the 187 U.S. equity Sector ETFs we cover. Figure 1 shows the most and least expensive Sector ETFs. ProShares provides three of the most expensive ETFs while Vanguard ETFs are among the cheapest. Sources: New Constructs, LLC and company filings Investors need not pay high fees for quality holdings. The Consumer Staples Select Sector SPDR ETF (NYSEARCA: XLP ) earns our Very Attractive rating and has low total annual costs of only 0.17%. On the other hand, the Schwab U.S. REIT ETF (NYSEARCA: SCHH ) holds poor stocks. No matter how cheap an ETF, if it holds bad stocks, its performance will be bad. The quality of an ETF’s holdings matters more than its price. 3. Poor Holdings Avoiding poor holdings is by far the hardest part of avoiding bad ETFs, but it is also the most important because an ETF’s performance is determined more by its holdings than its costs. Figure 2 shows the ETFs within each sector with the worst holdings or portfolio management ratings . Figure 2: Sector ETFs with the Worst Holdings Sources: New Constructs, LLC and company filings PowerShares appears more often than any other providers in Figure 2, which means that they offer the most ETFs with the worst holdings. Our overall ratings on ETFs are based primarily on our stock ratings of their holdings. The Danger Within Buying an ETF without analyzing its holdings is like buying a stock without analyzing its business and finances. Put another way, research on ETF holdings is necessary due diligence because an ETF’s performance is only as good as its holdings’ performance. PERFORMANCE OF ETF’s HOLDINGS = PERFORMANCE OF ETF Disclosure: David Trainer and Max Lee receive no compensation to write about any specific stock, sector, or theme. Disclosure: I/we have no positions in any stocks mentioned, and no plans to initiate any positions within the next 72 hours. (More…) I wrote this article myself, and it expresses my own opinions. I am not receiving compensation for it. I have no business relationship with any company whose stock is mentioned in this article.
Auto Sales On Top Gear: ETFs And Stocks To Ride On

The U.S. automotive industry is on top gear with fat wallets, rising income and increasing consumer confidence adding adequate fuel. This is especially true as auto sales rose 4.4% to 8.52 million units in the first half of 2015, representing the best six months in a decade. And that’s not all, auto sales are on track to hit 17 million for full-year 2015, a record not seen in the last 15 years. Notably, June sales increased 3.9% to 1.48 million units, driven by an 11% rise in light-truck sales. Five of the six major American and Japanese automakers reported strong sales for the last month led by Nissan ( OTCPK:NSANY ), which saw 13% growth. This was followed by the sales increase of 8.2% for Chrysler, 4.2% for Honda (NYSE: HMC ), 4.1% for Toyota (NYSE: TM ) and 1.5% for Ford Motor (NYSE: F ). However, sales at General Motors (NYSE: GM ) dropped 3% in June. Outlook Remains Solid The auto industry is poised to grow given that the economy is gaining traction after a first-quarter slump. The labor market is strengthening, consumer spending is increasing, and the housing market is improving gradually. Further, lower gasoline prices are providing huge boon to auto sales. While a slowdown in China and instability in Europe are the major headwinds, higher demand for pickups and crossovers, a plethora of new models, lower interest on auto loans and the need to replace aging vehicles should continue to drive the industry for the rest of the year. Adding to these strengths would be the summer selling season, which has started off strongly for automakers, and the holiday season at the end of the year which has a tradition of driving sales. Apart from these, about 60% of the industries falling under the auto sector have a strong Zacks Rank in the top 28%, suggesting healthy growth. This is well confirmed by the sector’s strong earnings growth of 8.7% for the second quarter and 22.4% for the third. Overall, auto is expected to be the best sector of 2015 among our 16 Zacks sectors with earnings growth of 24.8%. Given the bullish trends, investors may want to take a closer look at the ETFs and stocks from this corner of the broad market and could ride high with the following products: ETF to Buy Investors should note that there is only a pure play First Trust NASDAQ Global Auto ETF (NASDAQ: CARZ ) in the space that provides global exposure to the 37 auto stocks by tracking the NASDAQ OMX Global Auto Index. It is a large-cap-centric fund and highly concentrated on the top 10 holdings with about 61% of assets, suggesting that company-specific risk is high and that the top 10 firms dominate the returns of the fund. The four prime automakers – Ford, Honda, Toyota, and General Motors – are among the top five holdings. In term of country exposure, Japan takes the top spot at 35.4% while the U.S. and Germany round off the next two spots with 23.8% and 20.1% share, respectively. CARZ is under-appreciated and ignored by investors as indicated by its AUM of only $33.4 million and average daily trading volume of just under 8,000 shares. The product charges 70 bps in fees per year and has gained about 4.4% so far this year. The fund has a Zacks ETF Rank of 2 or ‘Buy’ rating with a High risk outlook. Stocks to Buy We have used our Zacks stock screener to find out the best stocks in the auto space having a Zacks Rank #1 (Strong Buy) or 2 (Buy) and a Growth Style Score of ‘B’ or better. The Growth Style Score analyzes the growth prospects of a company with a thorough analysis of the income statement, balance sheet and cash flow statement that evaluate its financial health and the sustainability of its growth trajectory. The results show that stocks with Growth Style Scores of A or B when combined with Zacks Rank of 1 or 2 offer the best upside potential. Meritor Inc. (NYSE: MTOR ) Based in Troy, Michigan, Meritor is a leading manufacturer and supplier of automotive parts across the globe. It supplies drivetrain, mobility, braking and aftermarket solutions for commercial vehicle and industrial markets under the brand names – Meritor, Meritor WABCO, Euclid, Trucktechnic, Mascot, and Meritor AllFit. Meritor has seen rising earnings estimates by 2 cents for the current fiscal year over the past 30 days. The 2015 Zacks Consensus Estimate of $1.40 represents a substantial year-over-year growth of 36.9% versus the industry average of 6.82%. Further, the company delivered positive earnings surprises in the last four quarters, with an average beat of 63.56%. The stock currently has a Zacks Rank #2 with a Growth Style Score of A, suggesting incredible growth in the months ahead. PACCAR Inc. (NASDAQ: PCAR ) Based in Bellevue, Washington, PACCAR is a global leading manufacturer and designer of premium light, medium, and heavy-duty trucks operating under the Kenworth, Peterbilt and DAF brand names. The stock has seen positive earnings estimate revisions from $4.51 to $4.53 per share for 2015 over the past 30 days, representing a year-over-year increase of 18.65% versus the industry average of 13.22%. The company delivered an average positive earnings surprise of 4.32% in the last four quarters. The stock has a Zacks Rank #2 with a Growth Style Score of B, meaning that it could be primed for more growth in the months to come. Original Post Editor’s Note: This article discusses one or more securities that do not trade on a major U.S. exchange. Please be aware of the risks associated with these stocks.

Greece’s ‘No’ Vote Means Little To These Funds

Some experts have argued that it is more about Greece’s crisis than being a Greek crisis, as it had been 5 years back. Yes, the financial world is now interconnected and no investor prefers uncertainty. The crisis will obviously impact Greece, but this time it is assessed to have limited or momentary impact on other key markets, some believe. Nonetheless, risk-averse investors may not be convinced by those beliefs. True, there are certain contradictory opinions as well. More importantly, the contradictory view has more to do with the impact on the US. According to some, uncertainty may compel the US Fed to withhold from raising rates perhaps in September. Also, the dollar may trend north. However, there are also others who cite that the US economy has limited direct exposure to the US. On that note, to make safe investments on the international zone, India and Japan may emerge as the right destinations. While funds have not enjoyed a very positive run in the first half of 2015, the Japan Stock fund category led the gains and was joined by 10 other foreign fund categories in the top 15 gainers. India had been a strong performer last year. Though the gains are not at par this year, the country has officially stated that it is “well insulated” from the Greece crisis. Before we pick the potential mutual funds from Japan and India, let’s look at Greece’s latest developments. An Overwhelming “No” On Sunday, 61% of Greece citizens voted against adopting further austerity measures offered by lenders. This poses serious questions about the economic future of the nation and whether it will continue to use the Euro. On the other hand, lenders will also have to ponder about their next move, which may have serious implications for the common currency bloc. This is in keeping with Prime Minister Tsipras’ recent statement and the position of his left-wing Syriza party. Time and again, Tsipras’ government has presented their own terms for an agreement and multiple negotiations have failed to break the deadlock. The Prime Minister has said that he would continue negotiations, backed by a fresh mandate. It is likely that he will continue to push for softer austerity measures and a renegotiation of existing terms. What Lenders May Do Leaders from the Eurozone have indicated that the immediate resumption of talks is unlikely. Now, Germany and France have asked Greece to offer serious proposals to hold fresh financial aid talks. Lenders now have to consider whether they will take extreme positions or agree to a compromise. German Chancellor Angela Merkel and French President Francois Hollande want Greece to be quick to secure a cash-for-reform deal with creditors; thereby avoiding Grexit. Say Yes to These Funds Shockwaves of the Greece vote may be felt in domestic markets and also across the world. However, foreign diversification is an important consideration for any investor. Both the Indian and Japanese stock markets did trend south following Greece’s ‘No’ vote, but they are expected to see limited effect. Japan: Keep Calm and Carry On Japan Finance Minister Taro Aso has said that Japan is prepared to respond to market developments related to the Greece crisis. Previously, he had said that declines in Japanese stocks were less likely to spread and the yen would not spike. Also, there will not be much impact even if Greece defaulted but chose to stay in the Eurozone. Reportedly, Bank of Japan officials said that the market reactions did not require emergency liquidity injection. However, the BOJ is ready to mobilize short-term funds in emergency market operations if the crisis deepens. Japan is said to have little direct connection with Greece. A Nomura economist explains that exports to and imports from Greece each are just 0.1% of Japan’s respective totals. Also, Japan’s financial institutions have just 37 billion yen worth of exposure to Greek debt, the loss of which will be easily offset by annual profits. Separately, Japan economy has enjoyed a handful of positive economic indicators this year. The Bank of Japan had noted that Japan’s economy is in a “moderate recovery trend”. The country’s benchmark Nikkei index has also soared to multi-year highs. The Rydex Japan 2x Strategy Fund (MUTF: RYJHX ) seeks to give returns that correspond to two times the performance of the fair value of the Nikkei 225 Stock Average. RYJHX invests in common stocks having market capital within the range of those listed in the index. Rydex Japan 2x Strategy H currently carries a Zacks Mutual Fund Rank #2 (Buy) . RYJHX boasts year-to-date and 1-year return of 29% and 16.5%. The 3 and 5 year annualized returns are 24% and 14.6%. The annual expense ratio of 1.54% is lower than the category average of 2.05%. There are no sales loads. The Matthews Japan Fund (MUTF: MJFOX ) invests most of its assets in preferred and common stocks of firms located in Japan. MJFOX may invest in companies of all sizes, but the adviser expects them to be mid to large-cap firms. Matthews Japan Investor currently carries a Zacks Mutual Fund Rank #1 (Strong Buy) . MJFOX boasts year-to-date and 1-year return of 23.6% and 16.1%. The 3 and 5 year annualized returns are 19.1% and 14.9%. The annual expense ratio of 1.03% is lower than the category average of 1.47%. There are no sales loads. India: “Well Insulated” from Greece Crisis Meanwhile, another potential investment destination should be India. India’s chief economic advisor Arvind Subramanian said: “This is a drama which is going to play out for some time. We are well protected in at least three ways: Our macro-economic situation is more stable. We have (forex) reserves. We are an economy which is still an attractive investment destination”. The minor direct linkage with Greece will let India escape with little impact. The only impact may be momentary. What may happen is growing risk aversion toward emerging markets may curtail some fund flow to the Indian market for the short term. However, it remains a market with low exposure and instead, Indian equities or funds will now provide a good buying opportunity. The Matthews India Fund (MUTF: MINDX ) seeks long-term capital growth. MINDX invests majority of its assets in stocks and convertible securities of firms based in India. Though MINDX invests in companies of all sizes, the adviser expects MINDX to invest in mid to large-cap companies. Matthews India Investor currently holds a Zacks Mutual Fund Rank #1. MINDX boasts year-to-date and 1-year return of 7.6% and 25.8%. The 3 and 5 year annualized returns are 24% and 10.7%. The annual expense ratio of 1.12% is lower than the category average of 1.76%. There are no sales load. The Eaton Vance Greater India Fund (MUTF: ETGIX ) seeks long term capital growth. ETGIX invests most of its assets in Indian equities and companies surrounding India. A minimum 50% of its assets are parked in Indian companies. ETGIX invests a maximum 5% of its assets in companies situated in countries other than India, Pakistan or Sri Lanka. Eaton Vance Greater India A currently holds a Zacks Mutual Fund Rank #1. ETGIX boasts year-to-date and 1-year return of 6.4% and 14.5%. The 3 and 5 year annualized returns are 16.2% and 4.8%. The annual expense ratio of 1.88% is however higher than the category average of 1.76%. ETGIX carries a front end sales load of 5.75%. Link to the original article on Zacks.com