Southwest Gas: A Weak Service Area Economy Snaps A Multi-Year Earnings Growth Streak
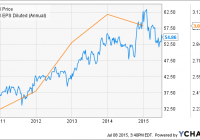
Summary Southwest Gas saw its earnings growth streak snapped last year by a weakening service area economy. The company’s share price rebounded recently as market volatility has pushed investors into defensive stocks such as utilities. While its historical performance is impressive, continued signs of weakness in its service area threaten to dampen future earnings growth for the company. Given the company’s relatively low forward dividend yield and lack of clearly undervalued shares, I recommend that investors seeking to reduce their volatility look elsewhere in the sector. Natural gas utility and construction service provider Southwest Gas (NYSE: SWX ) welcomed Q3 with a rebounding share price following a 17% decline in the first half of the year (see figure). While the company’s earnings have faltered of late, most recently with a Q1 earnings miss, much of its share price’s poor performance can be attributed to the prospect of U.S. interest rates being increased by the Federal Reserve for the first time in almost a decade. By contrast, Q3 to date has been beset by volatility arising from the high likelihood of an imminent “Grexit” and China’s recent stock market crash, both of which have driven investors back to bonds and utilities. Southwest Gas is finding its own earnings outlook under pressure due to slowing economic growth in much of its service area. This article evaluates the company as a potential long investment in light of these recent conditions. SWX data by YCharts Southwest Gas at a glance Operating as a public company since 1956, Nevada-based Southwest Gas provides natural gas and related services to its 1.9 million customers located in Arizona, Nevada, and eastern California. It has expanded significantly in recent decades and is now the largest natural gas provider in Arizona and Nevada. The company’s operations are split into two business segments. Its natural gas operations, which are regulated, generate approximately 87% of its consolidated earnings via transmission and distribution services. While the segment supplies natural gas to a wide customer base, with 53%, 37%, and 10% of them located in Arizona, Nevada, and California, respectively, 99% of them are residential and commercial in nature. Likewise, the segment generates most of its operating margin from Arizona and Nevada (56% and 34%, respectively). The second segment, named Centuri, which expanded last September following $185 million worth of acquisitions , provides construction services. This segment is divided between four construction subsidiaries: NPL construction, which installs underground piping, mostly in the western U.S.; Link-Line Contractors, which is a Canadian natural gas distribution contractor; W.S. Nicholls Construction, which engages in industrial construction projects in Canada; and Brigadier Pipelines, which installs midstream pipelines, primarily in Pennsylvania. While Centuri is a relatively small contributor to the company’s consolidated earnings, the firm believes that it has substantial growth opportunities due to demand for natural gas pipelines and distribution infrastructure in the wake of the advent of shale gas. Southwest Gas experienced strong earnings growth in the aftermath of the Great Recession as inexpensive shale gas and growing population in its service area drove consumption. Its annual diluted EPS increased by 38% between FY 2010 and FY 2013, although it declined slightly in FY 2014. This earnings growth in turn drove regular dividend increases, and the company’s annual dividend has increased by 62%, or a 10.1% CAGR, since FY 2010. The most recent increase came in the form of an industry-beating 11% boost that was announced earlier this year. Investors not surprisingly responded very positively to this record of earnings and dividend growth, pushing the company’s share price up by almost 100% between January 2011 and January 2015, handily beating the sector indices (see figure). Investors have lost some of their enthusiasm for the firm of late, however, following a disappointing Q1 earnings report and broader bearish sentiment across the utilities sector. SWX data by YCharts Q1 earnings report Southwest Gas reported a mixed bag of earnings for Q1 in May, beating on revenue but missing on EPS. Revenue came in at $734.2 million, up an impressive 20.7% from $608.4 million the previous year and beating the analyst consensus by $67.3 million. Several factors contributed to this YoY increase, including the company’s addition of 26,000 natural gas customers (an increase of 1.4%) over the trailing twelve months and the reporting of revenues from its construction services acquisitions (the latter resulted in a $30 million increase to revenue). The company’s natural gas operations segment did particularly well, increasing its revenue by 14% YoY, although this was mostly offset by a substantial increase to its cost of gas sold. Operating income rose slightly to $129.6 million from $127.1 million, with a $7.4 million increase by the natural gas segment being mostly offset by a $5 million decrease by the construction segment. The increase to the former was primarily driven by regulatory rate relief while the latter was hurt by a combination of poor weather conditions in its service area (Canada is not hospitable to Q1 construction work even in the best of times, which this year’s especially cold quarter was not). Integration expenses associated with last year’s acquisitions also hurt the construction segment’s operating income compared to the previous year, although these can be expected to decline in coming quarters. The company’s consolidated net income rose by 1.7% YoY from $70.8 million to $72.0 million (see table). Diluted EPS came in at $1.53 compared to $1.51 the previous year, missing the consensus estimate by $0.07. The natural gas segment did especially well, increasing its net income from $72.6 million to $78.9 million. The gain was the result of a higher operating margin resulting from the aforementioned rate relief and lower O&M expenses. The construction segment reported a net loss that widened from $1.8 million in FY 2014 to $6.9 million in the most recent quarter, with the poor performance being attributed to acquisition expenses and a required loss reserve of $5 million on one of its industrial projects. Southwest Gas Financials (non-adjusted) Q1 2015 Q4 2014 Q3 2014 Q2 2014 Q1 2014 Revenue ($MM) 734.2 627.7 432.5 453.2 608.4 Gross income ($MM) 129.6 112.4 18.3 26.8 127.1 Net income ($MM) 72.0 58.7 2.0 9.6 70.8 Diluted EPS ($) 1.53 1.25 0.04 0.21 1.51 EBITDA ($MM) 199.3 185.4 80.3 88.9 191.6 Source: Morningstar (2015). Southwest Gas reported a couple of regulatory developments from Q1 that will likely affect its future earnings. It received approval from California regulators for a $2.5 million margin increase that was established at the beginning of the year. It also received approval from Nevada regulators for the replacement later this year of $14.4 million worth of vintage plastic pipes with safer contemporary versions. Finally, it received preliminary environmental approval from federal regulators for a $35 million pipeline expansion project. Finally, the company’s management stated during its Q1 earnings call that it was not impacted by the extraordinary drought conditions in California during the quarter and does not expect this to change in coming quarters. While not surprising given the company’s focus on natural gas distribution rather than, say, hydroelectric generation, it is still good news for its investors. The company’s balance sheet ended the quarter in solid shape with $38.0 million in total cash and a current ratio of 1.1. It had very little short-term debt at $18.3 million and $1.5 billion in long-term debt, the latter down $131 million from the previous quarter. With a debt rating from the S&P 500 of BBB+ and a stable outlook, the company should have little difficulty financing its planned capex. Furthermore, management intends to increase the company’s dividend payout ratio from its current value of 48% closer to the industry average (68% TTM as of Q1 ), indicating that it has substantial room to increase if permitted by earnings growth. Outlook Management was comfortable enough with its results despite the earnings miss to reaffirm its full-year guidance during the earnings call. Population growth in the service area is expected to lead to 1.5% natural gas customer growth, a slightly higher rate than was reported the previous year. This in turn is expected to lead to operating margin growth of 2% despite higher assumed operating and pension costs, the latter resulting from the adoption of new mortality tables reflecting longer life expectancies. More importantly, the company expects to incur capex of $445 million in FY 2015, up from $315 million in FY 2013 and $350 million in FY 2014, with the increase driven by the replacement of existing infrastructure (such as the aforementioned vintage pipes) and an expansion of its service area. Beyond this year, the company expects to incur a total of $1.3 billion in capex through FY 2017. This spending will be driven by multiple investments, including a liquefied natural gas [LNG] storage facility that has received pre-approval from Arizona regulators and is expected to be operational within 30 months of receiving final approval. As with the aforementioned pipeline expansion, these investments will support the company’s rate base increase proposals in the coming years, ideally providing further room for earnings and dividend increases in the process. Future customer growth and natural gas demand will depend in large part on the economic health of the company’s service area, the outlook of which has dimmed recently. The unemployment rates of Arizona, Nevada, and California have fallen well below their post-recession highs but, despite this, all three remain above the U.S. average (see figure). Worse, Nevada’s rate has actually held steady at 7% over the last two quarters and, according to a recent report , fully 33% of the state’s population lives in “economically distressed communities,” making it the most distressed state in the U.S. Worse, its rate of employment growth in Q1 fell from 3.8% last year to 2.8% this year. Arizona, from which Southwest Gas derives the majority of its customers, has the third-highest unemployment rate in the country if underemployed workers are also counted. While its employment rate grew in Q1 compared to the previous year, it still only managed to achieve a measly 2.6%. Arizona and Nevada, which are together responsible for the majority of the company’s operating margin, have achieved slower GDP growth over the last several years (see second figure). Southwest Gas will struggle to reverse its declining ROE, both from its natural gas operations and its consolidated operations, so long as its service area economy remains weak, mitigating the advantage conferred by its relatively favorable ROEs allowed by regulators. Arizona Unemployment Rate data by YCharts Arizona Change in GDP data by YCharts Valuation The analyst estimates for Southwest Gas have declined over the last 90 days in response to its Q1 earnings miss. The FY 2015 and FY 2016 consensus estimates have declined from $3.18 and $3.39 to $3.14 and $3.35, respectively. Based on the company’s share price of $54.86 at the time of writing, its shares are trading at a trailing P/E ratio of 18.6x and forward FY 2015 and FY 2016 ratios of 17.5x and 16.4x, respectively. All three of these ratios have declined substantially, although the forward ratios would need to fall to roughly 15x for the company’s shares to be considered undervalued based on their historical valuations (see figure). SWX PE Ratio (TTM) data by YCharts Conclusion Natural gas utility Southwest Gas has been one of the sector’s better performers in recent years, benefiting from cheap natural gas and customer growth. While its records of sustained earnings and dividend growth make the company look attractive from a historical perspective, economic and employment growth in its service area have faltered in recent quarters. Furthermore, earnings growth aside, the company has reported declining ROEs over the last three fiscal years, which is a trend that it will struggle to reverse so long as its service area’s economy remains weak. At this time, its construction services segment is too small to be likely to offset the natural gas segment’s declining ROE in the next year or two, although its individual multi-year growth potential should be noted. I am not bearish on the firm and believe that it could outperform the broader market, especially if China’s market volatility and a looming Grexit cause investors to move toward defensive stocks. That said, in the absence of a compelling argument that its shares are undervalued (defined here as a share price below $47, or 13x estimated FY 2016 earnings), I recommend that potential investors look instead at those utilities firms with superior earnings growth prospects and dividend yields such as IDACORP (NYSE: IDA ), Alliant Energy (NYSE: LNT ), or DTE Energy (NYSE: DTE ). Disclosure: I/we have no positions in any stocks mentioned, and no plans to initiate any positions within the next 72 hours. (More…) I wrote this article myself, and it expresses my own opinions. I am not receiving compensation for it (other than from Seeking Alpha). I have no business relationship with any company whose stock is mentioned in this article.


