Tag Archives: applicationtime

Reaves Utility Income Fund: Monthly Payout Currently Offering A 6% Yield

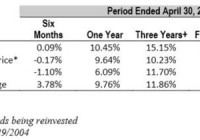
Summary Reaves Utility Income Fund is a CEF that invests in a broad range of utilities. Reaves is selling at a discount to NAV and offers a relatively safe 6% monthly yield. Reaves is not likely to outperform of underperform the utility indexes. About a year ago someone offered Reaves Utility Income Fund (NYSEMKT: UTG ) as a better alternative to my list of utilities in the comments section of an article I had written. I have been following the fund since that time and have placed this fund in some of the accounts I manage. UTG recently released its semi-annual report as of 4/30/2015. Total assets of the fund were $76,000 short of $1 billion and the net asset value (NAV) of the fund was $32.71 per share. UTG is currently selling for around $29.75 per share with a NAV of $30.37 as of 7/10/15. The recent underperformance of interest rate sensitive stocks has hurt both the NAV and selling price of the fund. UTG currently yields 6.1% with a monthly payout at just over $0.15 monthly. The price fluctuation of utilities does not affect the payouts of the companies so it may be an opportune time to consider this fund and/or utility stocks if one believes that interest rates will not rise shortly. UTG is a CEF or closed-end fund that aims to provide a high level of after-tax total returns consisting of tax-advantaged dividend income and capital appreciation. It targets 80% of its investment in dividend-paying common and preferred stocks as well as debt instruments of utility companies. The other 20% can be invested in other types of securities and/or debt instruments. It also uses options of utility companies in the search for returns. The historical returns of the fund when compared to the historical returns of the S&P Utilities Index and the Dow Jones Utility Average are shown in the table below: (click to enlarge) Source: UTG Semi-annual Report UTG also offered a graph showing the allocation of funds in its quarterly report as well. It is shown below: (click to enlarge) Source: UTG Semi-annual Report This graph shows that the fund’s definition of utility is rather broad. The fund holds railroads, roads, and oil and gas MLPs as well as REITs and media companies. UTG has loans for $290,000,000 with an interest rate of around 2%, which it uses for leverage. The top 10 holdings of the fund as of 3/30/15 were: NextEra Energy 5.27% ITC Holdings Corp 4.74% Union Pacific Corp. 4.67% Verizon Communications 4.26% American Water Works Co., Inc 3.96% Duke Energy Corp. 3.66% Scana Corp. 3.65% Dominion Resources, Inc. 3.59% BCE, Inc. 3.46% Sempra Energy 2.98% Expenses of this fund are about average for a closed-end fund. Investment advisory and administration fees last year ran $9.6 million or a little over 1% of the asset value of the fund. Other fees and interest on the loans add on another .5%, making a total of 1.5% to run the fund. Leverage probably covers the costs of administration with the additional dividend income it produces. Conclusion: This CEF is a good option for someone who wants to add utilities to their portfolio without the concern of researching individual companies. It appears to be a good bet for the retiree since it offers a monthly payout where much of the dividend qualifies for the 15% tax rate. The fund’s returns have kept up with the major utility indexes over its lifetime and will probably continue to do so in the foreseeable future. One should not expect to outperform the utility indexes with this CEF, but one will not likely underperform them either. Disclosure: I am/we are long UTG. (More…) I wrote this article myself, and it expresses my own opinions. I am not receiving compensation for it (other than from Seeking Alpha). I have no business relationship with any company whose stock is mentioned in this article. Share this article with a colleague
How Much Growth Exposure Is In Your Value Index? Perhaps More Than You Think

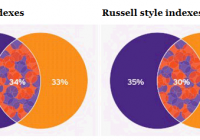
Summary In order to benefit from diversification within an investment portfolio, we believe investors need to combine assets that are less-than-perfectly correlated. Indexes representing growth and value investment styles often have the same holdings, which diminishes the potential diversification and risk reduction benefit within a portfolio. Investors can realize increased diversification benefits through exposure to pure style-based indexes that have no constituent overlap and weight constituents by style strength instead of market capitalization. To ensure proper style diversification, it’s critical to check your correlations By John G. Feyerer, Vice President, Director of Equity ETF Product Strategy, Invesco PowerShares Capital Management LLC Diversification. As the old saying goes, it’s the only free lunch in finance. Construction of investment portfolios involves mixing low or uncorrelated asset classes with varying risk/return profiles in order to attain the desired balance of risk and return potential. Correlation is a statistical measure of how securities move in relation to each other. For investors to benefit from diversification, they must combine assets that are less than perfectly correlated. The lower the correlation, the greater the diversification benefit. (While low correlations are good, negative correlations are even better.) Of course, diversification does not guarantee a profit or eliminate the risk of loss. Style investing as a means of diversification Traditional style investing, commonly used in the asset allocation process, is one means of diversifying a portfolio. A simple example of traditional style investing involves employing both growth and value investment styles across a full spectrum of company sizes – large-, mid- and small-cap. This approach is designed to improve performance, while reducing portfolio risk. Style allocations can also be used to tilt an investment portfolio based on an investor’s market outlook. Historically, investor implementation strategies have focused on finding active managers who could deliver “alpha,” or risk-adjusted performance, to fill each style box allocation. In recent years, passive strategies have also been widely adopted, as evidenced by $160 billion in net flows into style-based index mutual funds and $54 billion in net flows into style-based index exchange-traded funds (ETFs) over the past three years. During this time, style-based ETFs have grown to represent approximately 10% of the $2 trillion in U.S. ETF assets under management. 1 Constituent overlap can increase portfolio risk Given the desired outcome of improving performance while reducing portfolio risk, we believe it is important for ETF investors to “look under the hood” of the more popular style indices to understand the index construction methodology. Russell and Standard & Poor’s (S&P) provide some of the most widely used style indices, and both have at least 30% constituent overlap between growth and value allocations, as shown in the graphic below. Source: Bloomberg, L.P., May 31, 2015 What do we mean by this? An examination of index holdings illustrates that a number of companies have their weight apportioned between both the growth and value indexes based upon their strength of style. Index providers typically structure their style indexes in this way to provide exhaustive coverage (so that all parent index stocks are included in these benchmark indexes) and cost-efficient* exposure to the broad style market. But the overlap of constituent companies within these indexes typically results in higher correlations, which can help reduce diversification and increase portfolio risk. Given that nearly one-third of both the S&P and Russell style indexes contain the same stocks, investors should evaluate the degree to which they can benefit from diversification through a reduction in correlation. Pure style investing eliminates the issue of constituent overlap Recently, Russell introduced a suite of pure style indexes designed to include only stocks with pure growth and pure value characteristics. Unlike traditional style indexes, the Russell pure style methodology eliminates overlap and weights constituents based upon relative style attractiveness. This approach not only eliminates the issue of constituent overlap, but also focuses the exposure on companies that exhibit the greatest style strength. The table below illustrates these differences. Notice that the Russell growth style and the Russell value style both include four of the same large companies, while the Russell pure growth style and the Russell pure value style have no constituent overlap. Source: Bloomberg L.P., as of May 27, 2015 Now let’s consider the impact on correlations. In the table below, note how highly correlated Russell’s traditional value and growth style indexes are across the various indices: 0.79, 0.73 and 0.84 (a level of 1.00 reflects perfect correlation). This isn’t entirely surprising when you consider that a portion of each index consists of the exact same companies. Now observe the lower correlations between the various Russell pure value indexes: 0.58, 0.44 and 0.64. Russell’s pure style indexes show an average reduction in correlation of 30% when compared to Russell’s traditional value and growth indexes – driven by the fact that there isn’t any constituent overlap between the pure style indexes, as well as the fact that constituents are weighted based on style strength, rather than on market capitalization. Source: Russell Investments, as of July 1998-March 2015 In order to benefit from the “free lunch” that is afforded by diversification, we believe investors need to pay close attention to the correlations between the allocations within their portfolio. Some of the most commonly used style indices have significant constituent overlap – resulting in higher correlations, and thus hampering the ability of investors to reduce portfolio risk. By employing a strict construction discipline, Russell pure style indexes isolate companies that exhibit stronger style characteristics – resulting in a sharper, more focused and stylistically pure index. Learn more about Invesco PowerShares’ suite of ETFs based upon Russell’s pure style methodology. Source Morningstar, March 31, 2015 * Since ordinary brokerage commissions apply for each buy and sell transaction, frequent trading activity may increase the cost of ETFs. Important information The Russell Top 200 Pure Growth Portfolio holds a 0.2% position in Bristol-Myers Squibb (NYSE: BMY ), a 0.76% position in The Walt Disney Co. (NYSE: DIS ), a 2.18% position in Ecolab (NYSE: ECL ) and a 2.01% position in Starbucks (NASDAQ: SBUX ) as of July 8, 2015. The Russell Top 200 Pure Value Portfolio holds a 2.81% position in ConocoPhillips (NYSE: COP ) and a 2.97% position in PNC Financial Services (NYSE: PNC ) as of July 8, 2015. The Russell Top 200® Index , a trademark/service mark of the Frank Russell® Co., is an unmanaged index comprising the largest 200 securities by U.S. market cap. The Russell Midcap® Index , a trademark/service mark of the Frank Russell Co., is an unmanaged index considered representative of mid-cap stocks. The Russell 2000® Index , a trademark/service mark of the Frank Russell Co., is an unmanaged index considered representative of small-cap stocks. Russell is a trademark of the Frank Russell Co. There are risks involved with investing in ETFs, including possible loss of money. Index-based ETFs are not actively managed. Actively managed ETFs do not necessarily seek to replicate the performance of a specified index. Both index-based and actively managed ETFs are subject to risks similar to stocks, including those related to short selling and margin maintenance. Ordinary brokerage commissions apply. The Fund’s return may not match the return of the Index. The Funds are subject to certain other risks. Please see the current prospectus for more information regarding the risk associated with an investment in the Funds. Growth stocks tend to be more sensitive to changes in their earnings and can be more volatile. A value style of investing is subject to the risk that the valuations never improve or that the returns will trail other styles of investing or the overall stock markets. Stocks of small and mid-sized companies tend to be more vulnerable to adverse developments, may be more volatile, and may be illiquid or restricted as to resale. Investing in securities of large-cap companies may involve less risk than is customarily associated with investing in stocks of smaller companies. Investments focused in a particular industry or sector are subject to greater risk, and are more greatly impacted by market volatility, than more diversified investments. The information provided is for educational purposes only and does not constitute a recommendation of the suitability of any investment strategy for a particular investor. Invesco does not provide tax advice. The tax information contained herein is general and is not exhaustive by nature. Federal and state tax laws are complex and constantly changing. Investors should always consult their own legal or tax professional for information concerning their individual situation. The opinions expressed are those of the authors, are based on current market conditions and are subject to change without notice. These opinions may differ from those of other Invesco investment professionals. NOT FDIC INSURED MAY LOSE VALUE NO BANK GUARANTEE All data provided by Invesco unless otherwise noted. Invesco Distributors, Inc. is the U.S. distributor for Invesco Ltd.’s retail products and collective trust funds. Invesco Advisers, Inc. and other affiliated investment advisers mentioned provide investment advisory services and do not sell securities. Invesco Unit Investment Trusts are distributed by the sponsor, Invesco Capital Markets, Inc., and broker-dealers including Invesco Distributors, Inc. PowerShares® is a registered trademark of Invesco PowerShares Capital Management LLC (Invesco PowerShares). Each entity is an indirect, wholly owned subsidiary of Invesco Ltd. ©2015 Invesco Ltd. All rights reserved. How much growth exposure is in your value index? Perhaps more than you think by Invesco Blog

Sometimes One Mutual Fund Is More Than Enough

When it comes to investing, simple is sometimes beautiful. If you don’t actually like investing, doing as little as possible is definitely beautiful. And that can make the often misunderstood balanced fund beautiful. Investing isn’t easy. In fact, for some people it’s a daunting, even painful, task that quickly overwhelms. And, in the end, that can lead people to do the worst possible thing-nothing. For such people, and for those just starting their investing journey, the best option may be the misunderstood balanced fund. A beautiful breed of creatures that even experienced investors can learn to love if only you take the time to get to know them. What is a balanced fund? At the core, a balanced fund is meant to be a complete portfolio in one investment. In other words, it is quite possible that you could buy a single balanced fund and never make another investment decision again. At that point, all you ever need worry about is saving money. That is beautiful. But there are really three different kinds of funds that can be found in this broad category. There are balanced funds, asset allocation funds, and flexible funds. The differences can be pretty minor, but they are worth knowing. A balanced fund generally has a target allocation for stocks and bonds. However, it can usually make minor adjustments around those bands. For example, a fund might say that it will have between 40% and 80% of assets in equities at all time, with the remainder in bonds. In function the goal might be to have a 60%/40% split between stocks and bonds. However, the bands give the management team the ability to become more or less aggressive based on prevailing market conditions. An asset allocation fund, meanwhile, tends to be far more rigid in its approach. These funds are usually based off of modern portfolio theory and so called efficient frontiers. Essentially management figures out an allocation between different asset classes based on achieving the highest possible return for a desired amount of risk. Of course that’s based on past performance, so it doesn’t always work as planned. The key difference here is that this approach usually goes well beyond the simple stock/bond portfolio, taking into account slivers of the market such as large-cap growth, large-cap value, small-cap growth, small-cap value, precious metals, emerging markets, developed foreign markets, bonds, foreign bonds, emerging market bonds, high-yield bonds, real estate, etc. You can slice and dice a lot in the financial world. But in the end, the fund will have a fairly rigid percentage guideline for each asset class they include and stick close to it. Flexible funds can be similar to both asset allocation and balanced funds except that the managers can really do whatever they want allocation wise. In other words, they can go 100% stock or 100% bond or 100% cash or any combination they want. There are a lot fewer funds that follow this approach nowadays since modern portfolio theory and efficient frontiers have come into prominence. That said, there are some funds that act like the other two that might better be placed here. For example, the Vanguard Managed Payout Fund (MUTF: VPGDX ) decided to completely remove real estate funds from its portfolio in late 2013. A true asset allocation fund wouldn’t have done that. What’s the best option? Honestly, at some level the differences are minor enough to be meaningless. Yes, it would be a good idea to know what your fund does. But for an investor who hates investing, it’s far more important that you save money and invest than that you pick the perfect balanced fund variant. In the end, your efforts at saving money will be more important to your end results than the fund you pick. So don’t get bogged down in selecting a fund. That said, the simplest approach is probably a fund like the Vanguard Balanced Index Fund (MUTF: VBINX ). It has a 60%/40% split between the entire U.S. stock market (via an index fund that tracks the entire U.S. stock market) and the entire U.S. bond market (via an index fund that tracks the entire U.S. bond market). You can’t get more basic than that. And that split is rigidly maintained, so this is a true balanced fund and would work well for just about anyone. But if you like a little more zest, you might prefer something like Dodge & Cox Balanced Fund (MUTF: DODBX ). Dodge & Cox is a relatively small, though well respected, value focused shop. The fund is a balanced fund, too, but it has an allocation band for stocks of between 25% and 75%. The rest goes into bonds and cash. This fund would provide you the comfort of knowing that it can shift with the market and, for those of you who like to buy on the cheap, it uses a value approach to investing. This, too, would be a great option for most investors-except, perhaps, for those who prefer growth stocks. On the asset allocation front a simple example is Fidelity Four-In-One Index Fund (MUTF: FFNOX ). Although many funds get into far more detail, this one gives a reasonable view of the difference between a balanced fund, like Vanguard Balanced Index which owns all U.S. stocks and all U.S. bonds, and asset allocation, which engages a broader list of asset classes. In Fidelity Four-in-One’s case, those asset classes are large-cap U.S. stocks (48% of assets), small-cap U.S. stocks (12%), foreign stocks (25%), and U.S. bonds (15%). The fund tries to adhere to these allocations fairly closely and each is represented with an index fund. Flexible funds are often harder to find. However, they can hide in plain sight, too. My earlier example of Vanguard Managed Distribution Fund shows this. The fund has a model allocation to follow, but it doesn’t have to do so rigidly and can change. The shift out of real estate investment trusts is a good example. And several of the investment approaches it uses can’t be easily categorized into an asset class. For example, it invests in a market neutral strategy and a “minimum volatility” fund. What those two funds actually do is beyond the discussion here, but what’s important is that they don’t fit in a box and allow the fund to shift around a lot more than either a true balanced or asset allocation fund. That’s neither good nor bad, but it is something to understand. OK, now what? For people who really hate investing, but know they have to do it, my recommendation is usually Vanguard Index Balanced Fund. It’s fine, not great, not bad-just fine. And that’s enough for most people. For those who want to get into investing a little more, I’d say look at the other funds I mentioned and expand from there. But try to stick with a major fund company and try to keep expenses low. Your deciding factor should be finding a fund that feels like it fits with your personality. The goal is to pick something that you’ll be able to stick to for a long, long time. For new investors, this is a great way to start putting money to work while you start to learn about investing. For example, you might put the bulk of your money in a balanced, asset allocation, or flexible fund and keep say 20% on the side for you to start buying individual stocks. That way the bulk of your money is in what you might consider a foundation fund while you experiment with the rest of the house. As you get more experienced you can start shifting that balance more toward you managing your own money. Or not. For a more experienced investor, you might place a chunk of change into a balanced fund as the core of your portfolio and then use the rest to focus in on asset classes you know well. For example, buying Dodge & Cox Balanced Fund as a core holding (say 60% of your portfolio), and then buying large cap growth stocks. This would allow you to focus on an area in which you are most comfortable without undue overlap with your core. I normally call this a core and explore type approach. You could also substitute in real estate investment trusts, closed-end funds, and limited partners for growth, if you wanted. The general idea being the same in that you rely on the fund for broader diversification while you do the things that you do best (or the things you enjoy). The biggest impact you’ll have There are a wide variety of ways to use balanced, asset allocation, and flexible funds. However, what they really do is provide simplification. And that’s more important than you may think. Investing can be very, very complicated if you let it. This can distract from what will be your most important contribution to your future financial success-the amount of money you save. And, in the end, saving is really the hard part of this because we humans are notoriously bad at delaying gratification. So, if you are new to investing or hate the idea of investing, find a decent one-and-you’re-done fund and focus on saving money. As you get more comfortable you can change how you do things. But start by, well, starting simple. And if you are more experienced, don’t overlook the value of a sound, and diversified, foundation around which you can build a core and explore portfolio. In the end, sometimes, all you really need is one single solitary fund. Disclosure: I/we have no positions in any stocks mentioned, and no plans to initiate any positions within the next 72 hours. (More…) I wrote this article myself, and it expresses my own opinions. I am not receiving compensation for it (other than from Seeking Alpha). I have no business relationship with any company whose stock is mentioned in this article.