Tag Archives: applicationtime

Global Equities Bounce; Still Oversold

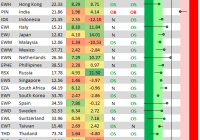
At last Wednesday’s close, global markets had pretty much all reached extreme oversold territory. Below is a snapshot of where things stand after the rally we’ve seen over the last three trading days. The screen below shows the 30 largest country ETFs traded on US exchanges. The dot represents where the ETF is currently trading within its range, while the tail end represents where it was trading one week ago. The black vertical “N” line represents each ETF’s 50-day moving average, and moves into the red or green zones are considered overbought or oversold. We’ve also included both the 3-day change and year-to-date change for each ETF. Even after the huge bounce we’ve seen, nearly half of the countries shown remain slightly oversold, and none of the countries that have bounced have moved back above their 50-day moving averages. The 50-DMA is the next resistance level for most of these ETFs to clear, so we’ll be watching closely this week to see if the resistance can be broken. Share this article with a colleague

The Natural Gas Market Remains Soft – UNG Is Slightly Down

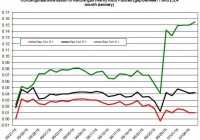
The price of UNG remains low and has declined by 2% since the beginning of the month. The weather is expected to heat up, but only in parts of the U.S. Will this be enough to drive up the demand for natural gas in the power sector? The natural gas market has started to cool down in the past couple of weeks, as the price of the United States Natural Gas ETF (NYSEARCA: UNG ) has declined by 2% since the beginning of the month. However, it’s still early to consider a downward trend in the price of UNG. And the market is still expected to remain soft in the near term, with higher-than-normal injections to storage, normal temperatures, robust production and low demand for natural gas. Unless the weather heats up, the price of UNG isn’t going anywhere. In the futures markets, contango has gone up mostly for the month of November – this is when the demand for natural gas is likely to pick up on account of higher consumption in the residential/commercial sectors (the start of winter). In November, the extraction season is expected to commence. (click to enlarge) (Data Source: EIA) But for the near-term contracts – September and October – contango hasn’t picked up by much, and as such, it’s not likely to have much of an impact on the roll decay of UNG. In the recent EIA weekly update , underground storage rose by 91 Bcf – a bit higher than market expectations, which stood at 86 Bcf. This was also higher than the 5-year average of 75 Bcf. Furthermore, in the coming weeks, analysts still project that the storage will rise at a faster pace than the 5-year average. Despite the higher pace in injections, the price of UNG has rallied in the past few days. Even the modest decline in natural gas consumption – down by 2% week on week, mainly due to lower consumption in the power sector – hasn’t driven down the price of UNG. The weather, which was expected to heat up, didn’t do so. The average temperatures were close to normal levels. Looking forward, the weather forecasts show colder-than-normal temperatures in parts of the west coast and the northeast. And warmer-than-normal weather throughout the south. Nonetheless, the cooling degree days (CDD) are expected to be higher: 19 degrees higher than normal and 27 degrees above 2014 levels. So we have a mixed signal about where the demand for natural gas in the power sector is heading this week. If the weather does turn out to be warmer than normal. The supply continues to slowly pick up, as production is still 5.4% higher than last year. Also, the number of rigs hasn’t changed much in the past few weeks: According to Baker Hughes , as of last week, the number of gas rigs slipped by 2 to 217. So far, this summer hasn’t been too hot. The power sector, which plays a more important role in this time of the year, relative to other sectors, has kept the price of UNG at its current low level. Unless the weather starts to heat up again, the injections will continue to be higher than normal and UNG will remain low. For more please see: ” On the Contango in the Natural Gas Market “. Disclosure: I/we have no positions in any stocks mentioned, and no plans to initiate any positions within the next 72 hours. (More…) I wrote this article myself, and it expresses my own opinions. I am not receiving compensation for it (other than from Seeking Alpha). I have no business relationship with any company whose stock is mentioned in this article.
Dual Momentum July Update

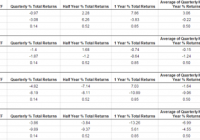
Scott’s Investments provides a free ” Dual ETF Momentum ” spreadsheet, which was originally created in February 2013. The strategy was inspired by a paper written by Gary Antonacci and available on Optimal Momentum . Antonacci’s book, ” Dual Momentum Investing: An Innovative Strategy for Higher Returns with Lower Risk “, also details Dual Momentum as a total portfolio strategy. My Dual ETF Momentum spreadsheet is available here , and the objective is to track four pairs of ETFs and provide an “Invested” signal for the ETF in each pair with the highest relative momentum. Invested signals also require positive absolute momentum, hence the term “Dual Momentum”. Relative momentum is gauged by the 12-month total returns of each ETF. The 12-month total returns of each ETF is also compared to a short-term Treasury ETF (a “cash” filter) in the form of the iShares Barclays 1-3 Treasury Bond ETF (NYSEARCA: SHY ). In order to have an “Invested” signal, the ETF with the highest relative strength must also have 12-month total returns greater than the 12-month total returns of SHY. This is the absolute momentum filter, which is detailed in depth by Antonacci, and has historically helped increase risk-adjusted returns. An “average” return signal for each ETF is also available on the spreadsheet. The concept is the same as the 12-month relative momentum. However, the “average” return signal uses the average of the past 3-, 6-, and 12- (“3/6/12”) month total returns for each ETF. The “invested” signal is based on the ETF with the highest relative momentum for the past 3, 6, and 12 months. The ETF with the highest average relative strength must also have an average 3/6/12 total returns greater than the 3/6/12 total returns of the cash ETF. Portfolio123 was used to test a similar strategy using the same portfolios and combined momentum score (“3/6/12”). The test results were posted in the 2013 Year in Review and the January 2015 Update. Below are the four portfolios along with current signals: (click to enlarge) As an added bonus, the spreadsheet also has four additional sheets using a dual momentum strategy with broker-specific commission-free ETFs for TD Ameritrade, Charles Schwab, Fidelity, and Vanguard. It is important to note that each broker may have additional trade restrictions, and the terms of their commission-free ETFs could change in the future. Disclosures: None Share this article with a colleague