Tag Archives: applicationtime

Global X Serves Up A New Alternative ETF

By DailyAlts Staff Global X Funds has a growing line of “SuperDividend” ETFs, and the latest is sure to be of interest to liquid alts investors: the Global X SuperDividend Alternatives ETF (NASDAQ: ALTY ) , which began trading on the Nasdaq on July 14. The ETF is the sixth in Global X’s SuperDividend ETF series and is designed to closely track the INDXX SuperDividend Alternatives Index. The underlying index tracks the performance of the highest dividend-yielding securities in each category of alternative income investments, as defined by index sponsor INDXX. This includes MLPs (master limited partnerships), REITs (real estate investment trusts), BDCs (business development companies), and other nontraditional income-producing investments. The Global X SuperDividend Alternatives ETF’s aim is to provide income from alternative sources with low correlation to dividend stocks and other traditional income investments. The strategy also seeks to limit volatility by screening for lower-volatility investments and overweighting categories that have been less volatile, historically. “The alternatives space encompasses a broad range of investments with risks, returns and correlations that differ from traditional equity and fixed income securities,” said Jay Jacobs, research analyst at Global X Funds, in a recent statement. “Investors are increasingly looking for alternative solutions that can potentially generate high income while diversifying their portfolios. Applying the SuperDividend approach to the alternative income space is a natural extension of our suite.” In practice, the Global X SuperDividend Alternatives ETF carries exposure to MLPs and other infrastructure companies, REITs and other real estate investments, alternative managed portfolios, and fixed-income and derivative strategies. As of July 13, REITs accounted for the largest share of the fund’s holdings at over 26%, while private equity and BDCs accounted for the next-largest share at over 19%. MLPs constituted less than 9% of the fund’s holdings, according to the fund’s fact sheet . On the downside, the Global X SuperDividend Alternatives ETF’s expense ratio is rather high at 3.03%. This is largely a function of the fact that the fund invests in other funds, according to ETF.com , and, as required, includes the underlying expense ratios of those fund in its expense ratio.

Why Optimal Portfolios Are So Difficult To Create

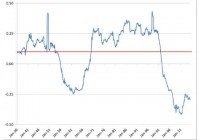
Harry Markowitz won a Nobel Prize in Economics in 1990 for his work on a theory of portfolio management for individual wealth holders. Since that time, Modern Portfolio Theory (MPT) has become the bedrock for creating best-practice portfolio selection methods. Creating an optimal portfolio consists of estimating a portfolio’s future risk and expected return as accurately as possible, based on a variety of inputs. It’s that “as accurately as possible” qualifier that makes the exercise a substantial challenge. MPT requires an investor (or his or her portfolio manager) to: Input expected asset class returns. Estimate the covariances between asset classes, or equivalently, the standard deviations and estimated correlations among asset classes. Decide on portfolio constraints, meaning the limits on the amount going into each asset class. Investors can then compare potential optimal asset allocations for the level of risk they are seeking for their overall portfolio. While there is extensive literature on MPT, accurately projecting an optimal portfolio forward strikes me as nearly impossible. The problem is the estimates. What goes into forecasting an optimal asset allocation has a big impact on what comes out. This often results in suggested optimal allocations that are quite inaccurate, and may lead to portfolio decisions that are counter-productive. Most MPT analysis relies on historical return, risk, covariance and correlation, at least as a starting point. We know that past data can be period-sensitive, so these estimates are often adjusted based on subjective input factors. Investors may have broad views of future Federal Reserve interest rate policy or of the future equity risk premium (ERP). This range of opinion can add wide variability to the accuracy of the outcome. Using only historical data for covariance and correlation can lead to large errors in portfolio optimization. For example, the long-term average correlation between US stocks and 5-year Treasury bonds from 1926-2014 has been +0.1 (correlation ranges from +1.0 to -1.0). However, an analysis of rolling correlation shows this average is far from stable. The 10-year correlation passes through +0.1 on rare occasions, but isn’t there for long. Figure 1 highlights the long-term average correlation (red line) between US stock and 5-year Treasury bond returns using monthly data from January 1936 through September 2014, and the rolling 10-year correlations (blue line) over the same period. Correlation is dynamic, not stable. When you measure correlation and how you measure it has a large bearing on the optimization output. Figure 1: Rolling 10-year Correlation of US stocks and 5-year T-bonds (click to enlarge) Source: CRSP Total US market and Treasury data from Dimensional Fund Advisors, figure by Rick Ferri Markowitz acknowledges the problem of using inaccurate correlation estimates for portfolio optimization in a recent paper he co-authored: ” Enhancing Multi-Asset Portfolio Construction Under Modern Portfolio Theory with a Robust Co-Movement Measure ” by Sander Gerber, Markowitz and Punit Pujara. The authors then attempt to address the issue with a more complex approach to estimating this variable. While the analysis is beyond the scope of this article, it’s fair to say that accurately estimating future correlation is a difficult problem for investors who are trying to solve the optimization puzzle. There are other ways to estimate portfolio risk and return that circumvent correlation estimates. One way is to assume there is no efficient frontier . Each asset class used in a portfolio has its own expected risk and return, and a portfolio of asset classes has an expected risk and return based on the weighted average risk and return of each asset class used in the portfolio. There is no assumed benefit from MPT. The weighted average method to estimating a portfolio’s overall risk and return may be a throwback in time, but it is conservative and does eliminate errors from inaccurate asset class covariance or correlation forecasts. You can read more about this method in my book All About Asset Allocation . Portfolio optimization sounds elegant in theory, but using it in practice is another matter. To have a useful outcome, MPT methodology requires an investor to input accurate asset class expected returns, standard deviation, and covariance or correlation among asset classes. That’s a tall order. Perhaps additional research such as the paper mentioned herein will help, but I’m not betting my retirement savings on it. Disclosure: Author’s positions can be viewed here .

The Low Volatility Anomaly: Leverage Aversion Hypothesis

This series digs deeper into the Low Volatility Anomaly, or why lower risk stocks have historically produced stronger risk-adjusted returns than higher risk stocks or the broader market. The CAPM links expected returns with an asset’s sensitivity to systematic risk, but the model assumptions are impractical. This article covers a deviation between model and market that may contribute to the outperformance of low volatility strategies. Given the long-run structural alpha generated by low volatility strategies, I am dedicating a more detailed discussion of the efficacy of this style of investing. In the first article in this series , I provided an introduction to the strategy with a simple example demonstrating a low volatility factor tilt (replicated through SPLV ) from the S&P 500 (NYSEARCA: SPY ) that has generated long-run alpha. In the second article in this series , I provided a theoretical underpinning for the presence and persistence of a Low Volatility Anomaly, and linked to articles depicting its success dating back to the 1930s. This article demonstrates that violations of the assumption of the Capital Asset Pricing Model (CAPM) lead to deviations between model and market that pervert the presumed relationship between risk and return. Empirical evidence, academic research and long time series studies across asset classes and geographies have shown that the actual relationship between risk and return is flatter than the model or market expectations suggests. The third article in this theory lays out a hypothesis for why low volatility strategies have produced higher risk-adjusted returns over time. Leverage Aversion Hypothesis The fallacy of the Capital Asset Pricing Model assumption that investors are able to borrow and lend at the risk-free rate might be the supposition that most perverts the model application from real world practice. Certainly not all investors are able to use leverage, and the cost and availability of leverage can deviate materially from any notion of a risk-free rate in times of stress. Intuitively, leverage-constrained or leverage-averse investors often choose to overweight riskier assets, increasing the price of risky assets and lowering expected return. If some market participants are overweight riskier assets characterized by lower expected returns, then they must be underweight lower risk assets which would be characterized by higher expected returns. In the CAPM model, rational market participants seeking to maximize their economic utility invest in the portfolio with the highest expected return per unit of risk, and lever or de-lever their portfolio to suit their own risk tolerance. In practice, however, many large institutional investors including most mutual funds and certain pension funds are constrained by the level of leverage that they can take. Furthermore, many individual investors lack the sophistication or access to attractively priced leverage. The growing increase in the assets under management of exchange traded fund products with embedded leverage could well signal small investor’s inability to access leverage directly on favorable terms. If market participants respond by being overweight riskier securities, then the relationship between risk and expected return is altered. Building on the long time series studies from Black and Haugen of the relative outperformance of lower volatility assets in the last article in this series, Frazzini and Pederson (2010) empirically demonstrated the alpha-generative nature of low beta assets across twenty international equity markets, Treasury bonds, corporate bonds, and futures. The duo also introduced a “Betting Against Beta” factor that gave the paper its name. The factor is effectively a zero beta portfolio that is long leveraged low-beta assets and short high-beta assets to produce statistically significant risk-adjusted across many markets, geographies, and time intervals. This study also demonstrated that the return of the BAB factor is sensitive to funding constraints as one would expected in a trade involving leverage. The persistence of an alpha-generative strategy involving leverage applied to low volatility assets, whose excess return is in part a function of the funding environment, supports the Leverage Aversion Hypothesis as an explanation for the Low Volatility Anomaly. In the next section of this series, we will tackle how the delegated agency model typical of investment management may also contribute to the outperformance of Low Volatility strategies. Disclaimer My articles may contain statements and projections that are forward-looking in nature, and therefore, inherently subject to numerous risks, uncertainties and assumptions. While my articles focus on generating long-term risk-adjusted returns, investment decisions necessarily involve the risk of loss of principal. Individual investor circumstances vary significantly, and information gleaned from my articles should be applied to your own unique investment situation, objectives, risk tolerance, and investment horizon. Disclosure: I am/we are long SPLV, SPY. (More…) I wrote this article myself, and it expresses my own opinions. I am not receiving compensation for it (other than from Seeking Alpha). I have no business relationship with any company whose stock is mentioned in this article.