Tag Archives: applicationtime

Dividend Growth Stock Overview: Northwest Natural Gas Company

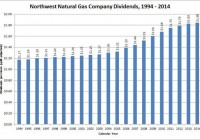
About Northwest Natural Gas Company Northwest Natural Gas Company (NYSE: NWN ) is a natural gas distribution and storage company serving over 705,000 residential, commercial and industrial customers in western Oregon and southwestern Washington. The company and its subsidiaries own and operate 31 billion cubic feet of designed storage capacity in Oregon and California. The company has been in business since 1859, and was incorporated in Oregon in 1910 and began doing business under its current name in 1997. Northwest Natural Gas is headquartered in Portland, OR and employs about 1,000 people. Northwest Natural Gas has two core business segments, the Utility Segment and the Storage Segment. The Utility Segment, which accounts for nearly all of the company’s income, runs the company’s regulated local gas distribution business, which serves over 100 cities in 18 counties with an estimated total population of 3.5 million. The segment receives about 66% of the needed gas supplies from Alberta and British Columbia provinces in Canada and the rest from the U. S. Rocky Mountain region. Segment revenues are driven by the rates determined by the regulatory authorities and by the volume of gas delivered. The volume of gas delivered is itself driven by customer growth. In 2013 and 2014, the company saw customer growth of 1.3% and 1.4%, respectively. The segment earned $2.15 per share in 2014. The Storage Segment provides gas storage services for utilities, large industrial users, electric power companies and other customers. The company signs agreements with customers of varying durations. Most service agreements range from 1-10 years, but some can last as long as 28 years. Segment revenue is driven by increased demand and, in the case of California-based storage, state renewable portfolio standards and carbon reduction targets. The segment lost a penny per share due to the reduction of revenues from the renegotiation of storage contracts that expired in 2014. In addition to the two segments noted above, the company also earned a small amount of money from the sales of appliances from the company’s store. This contributed 2 cents per share to 2014 earnings. In 2014, Northwest Natural Gas earned $58.7 million on $754.0 million of revenue. Net income was down 3% on slightly lower revenues as compared to 2013. Earnings per share were $2.16, down 3.6% from 2013. Based on this and given the annualized dividend rate of $1.86, Northwest Natural Gas has a payout ratio of 86.1%. As mentioned above, the Utility Segment saw earnings growth from customer growth and rate increases, which was offset from lower earnings from the Storage Segment. In the 1st quarter of 2015, Northwest Natural Gas earned $1.37, down from $1.40 in the same quarter in 2014. The decrease was exclusively due to a $9.1 million after-tax charge from a regulatory environmental disallowance. Northwest Natural Gas had a share repurchase program that expired in May 2015. As part of this program, 2.1 million shares had been repurchased since 2000 at a total cost of $83.3 million. The company has not announced a new share repurchase program. The company is a member of the S&P Small Cap 600 and Russell 2000 indices and trades under the ticker symbol NWN. As of mid-July, NWN stock yielded 4.2%. Northwest Natural Gas Company’s Dividend and Stock Split History (click to enlarge) Northwest Natural Gas has compounded dividends at 3.6% over the 10 years ending in 2014. With a dividend growth record that dates back to 1956, Northwest Natural Gas has one of the longest records of year-over-year dividend growth among all publicly traded companies. The company announces annual dividend increases in early October and schedules the stock to go ex-dividend at the end of October. I expect the company to announce its 60th year of dividend growth in October 2015. Like most utilities, Northwest Natural Gas generally grows its payout slowly, with year-over-year increases between 0.5% and 5.5%. From 2009-2014, the company compounded dividends at 2.89%; for the 10 and 20 years ending in 2014, the dividend growth rate is 3.56% and 2.29%, respectively. Northwest Natural Gas has split its stock once in the last 20 years – a 3-for-2 split in September 1996. Over the 5 years ending on December 31, 2014, Northwest Natural Gas stock appreciated at an annualized rate of 6.11%, from a split-adjusted $36.41 to $48.97. This significantly underperformed the 13.0% annualized return of the S&P 500 index, the 15.9% annualized return of the S&P Small Cap 600 index, and the 14.0% compounded return of the Russell 2000 Small Cap index over the same period. Northwest Natural Gas Company’s Direct Purchase and Dividend Reinvestment Plans Northwest Natural Gas has both direct purchase and dividend reinvestment plans. You do not need to be an investor in Northwest Natural Gas to participate in the plans. As a new investor, your initial investment must be at least $250. Subsequent direct investments have a minimum requirement of $25. The dividend reinvestment plan permits you to reinvest all or some of your dividends. The fee structures of the plans are favorable to investors, as Northwest Natural Gas picks up the costs of stock purchases directly from the company. (Stock purchases made on the open market are subject to brokerage commissions.) When you sell your shares, you’ll pay a transaction fee of $15 and the associated brokerage fees, which will be deducted from the sales proceeds. Helpful Links Northwest Natural Gas Company’s Investor Relations Website Current quote and financial summary for Northwest Natural Gas ( finviz.com ) Information on the direct purchase and dividend reinvestment plans for Northwest Natural Gas Disclosure: I do not currently have, nor do I plan to take positions in NWN
Best And Worst Q3’15: Energy ETFs, Mutual Funds And Key Holdings

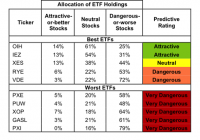
Summary The Energy sector ranks last in Q3’15. Based on an aggregation of ratings of 20 ETFs and 90 mutual funds in the Energy sector. OIH is our top-rated Energy ETF and FSESX is our top-rated Energy mutual fund. The Energy sector ranks last out of the 10 sectors as detailed in our Q3’15 Sector Ratings for ETFs and Mutual Funds report. It gets our Dangerous rating, which is based on aggregation of ratings of 20 ETFs and 90 mutual funds in the Energy sector. See a recap of our Q2’15 Sector Ratings here . Figures 1 and 2 show the five best and worst-rated ETFs and mutual funds in the sector. Not all Energy sector ETFs and mutual funds are created the same. The number of holdings varies widely (from 25 to 163). This variation creates drastically different investment implications and, therefore, ratings. Investors seeking exposure to the Energy sector should buy one of the Attractive-or-better rated ETFs or mutual funds from Figures 1 and 2. Figure 1: ETFs with the Best & Worst Ratings – Top 5 (click to enlarge) * Best ETFs exclude ETFs with TNAs less than $100 million for inadequate liquidity. Sources: New Constructs, LLC and company filings The PowerShares Dynamic Oil & Gas Services Portfolio ETF (NYSEARCA: PXJ ) is excluded from Figure 1 because its total net assets are below $100 million and do not meet our liquidity minimums. Figure 2: Mutual Funds with the Best & Worst Ratings – Top 5 (click to enlarge) * Best mutual funds exclude funds with TNAs less than $100 million for inadequate liquidity. Sources: New Constructs, LLC and company filings The Market Vectors Oil Services ETF (NYSEARCA: OIH ) is the top-rated Energy ETF and the Fidelity Select Energy Service Portfolio (MUTF: FSESX ) is the top-rated Energy mutual fund. OIH earns our Attractive rating and FSESX earns our Neutral rating. The PowerShares DWA Energy Momentum Portfolio ETF (NYSEARCA: PXI ) is the worst-rated Energy ETF and the Saratoga Energy & Basic Materials Fund (MUTF: SBMBX ) is the worst-rated energy mutual fund. Both earn a Very Dangerous rating. 187 stocks of the 3000+ we cover are classified as energy stocks. National-Oilwell Varco (NYSE: NOV ) is one of our favorite stocks held by Energy ETFs and mutual funds and earns our Very Attractive rating. Since 2009, National Oilwell has grown after-tax profit ( NOPAT ) by 11% compounded annually. National Oilwell has a return on invested capital ( ROIC ) of 10% and over $4 billion in free cash flow on a trailing twelve-month basis. Due to the recent decline in energy-related securities, NOV can be purchased well below its fair value. At its current price of ~$43/share, NOV has a price to economic book value ( PEBV ) ratio of 0.6. This ratio implies that the market expects National Oilwell’s NOPAT to permanently decline by 40%. If National Oilwell can grow NOPAT by just 3% compounded annually for the next six years , the stock is worth $80/share today – an 86% upside. Marathon Petroleum Corp (NYSE: MPC ) is one of our least favorite stocks held by Energy ETFs and mutual funds and earns our Very Dangerous rating. Marathon’s NOPAT has declined from $3.3 billion in 2011 to -$589 million in 2014. ROIC has also fallen from 15% to 1%. Investors not reading the footnotes would be unaware of the deteriorating business fundamentals. Due to a change in LIFO inventory value we remove $3.4 billion from Marathon’s 2014 income statement. Without making this adjustment the market has been led to believe that profits actually grew in 2014. The disconnect between NOPAT and net income could explain why MPC is up 39% over the last year despite the Energy sector being down 27%. To justify its now overvalued price of $56/share, MPC must grow revenues by 16% compounded annually for the next 13 years while also raising its current NOPAT margin from -0.6% to 2.5%. Marathon has only grown revenue by 8% compounded annually since 2011. Expecting Marathon to double its revenue growth in a weak Energy environment and maintain that high level for over a decade seems rather optimistic. Figures 3 and 4 show the rating landscape of all Energy ETFs and mutual funds. Figure 3: Separating the Best ETFs From the Worst ETFs (click to enlarge) Sources: New Constructs, LLC and company filings Figure 4: Separating the Best Mutual Funds From the Worst Mutual Funds (click to enlarge) Sources: New Constructs, LLC and company filings D isclosure: David Trainer and Allen Jackson receive no compensation to write about any specific stock, sector or theme. Disclosure: I/we have no positions in any stocks mentioned, and no plans to initiate any positions within the next 72 hours. (More…) I wrote this article myself, and it expresses my own opinions. I am not receiving compensation for it. I have no business relationship with any company whose stock is mentioned in this article.

Meritage Partners With Behringer For Distribution Of The Insignia Macro Fund

By DailyAlts Staff The strategic agreement between Behringer Securities and Meritage Capital is starting to bear fruit. Back in May, the two firms announced an agreement to develop, manage, and distribute specialized, multi-strategy investment funds intended to address the challenges presented by market volatility. On July 20, Behringer formally announced that it will be distributing the Insignia Macro Fund (MUTF: IGMFX ), an open-end mutual fund managed by Meritage. The Insignia Macro Fund initially debuted on December 31, 2013. It employs global-macro investment strategies in pursuit of attractive long-term risk-adjusted returns. The multi-manager fund is unique among global macro mutual-fund offerings in that it allocates to “discretionary focused managers.” Per the fund’s most recent fact sheet date 4/30/15, the $64 million fund employed seven underlying managers in the following weights: 16.53% – H2O Asset Management Discretionary Macro | Fundamental 15.85% – Willowbridge Associates Discretionary Macro | Fundamental 14.91% – The Cambridge Strategy Quantitative | Fundamental & Technical Models 14.80% – QMS Capital Management Quantitative | Fundamental & Technical Models 14.77% – Tlaloc Capital Discretionary Macro | Fundamental 13.92% – Crabel Capital Management Quantitative | Short Term 9.22% – Blackwater Capital Management Trend Follower | Pattern Recognition “Historically, global macro strategies have shown higher long-term returns with lower volatility than developed equity markets – and little correlation to stocks, bonds or other investments,” said Meritage CEO Alex Smith, in a recent statement. “We are pleased that the Fund will be distributed on Behringer Securities’ platform, and we look forward to our continued partnership.” In the same statement, Behringer CEO Frank Muller said the addition of the Insignia Macro Fund to Behringer’s platform indicates Behringer’s commitment to providing financial advisors with access to “nimble, entrepreneurial managers, strategies and structures to build better portfolios.” He also said the fund helps investors “identify portfolio diversifiers” and preserve their wealth. The past year has been both hot and cold for global macro funds, and the Insignia Macro Fund is no exception. Its A-class shares returned 9.31% for the year ending June 30, ranking in the top 42% of the funds in its Morningstar category (Managed Futures). But for the final six months of that period, the fund returned just 0.66% – and yet, this was enough for it to rank in the top 24% of the category. The Insignia Macro Fund is also available in institutional-class shares (MUTF: IGMLX ). Class A shares have a net-expense ratio of 2.00%, while the institutional shares carry fees of 1.75%. The minimum initial investment for the A shares is $2,500; while the minimum for institutional shares is 100 times higher, at $250,000. For more information, visit insigniafunds.com .