Tag Archives: applicationid

Tax Efficient Large-Cap Portfolio Management System With Minimum Volatility Stocks Of The S&P 500

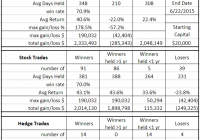
This model invests periodically in eight highly liquid large-cap stocks selected from those considered to be minimum volatility stocks of S&P 500 Index. Most stock positions are held for longer than one year, resulting in a Tax Efficiency ratio of 81.4%. When adverse stock market conditions exist the model shorts the 3x leveraged Ultra Pro S&P 500 ETF – hedge/current holding ratio= 45%. The model produced a simulated average annual return of about 36% from Jan-2000 to end of June-2015. The Minimum Volatility Stock Universe of the S&P 500 Minimum volatility stocks should exhibit lower drawdowns than the broader market and show reasonable returns over an extended period of time. It was found that a universe of stocks mainly from the Health Care, Consumer Staples and Utilities sectors satisfied those conditions. This minimum volatility universe of the S&P 500 currently holds 117 large-cap stocks (market cap ranging from $4- to $277-billion), and there were 111 stocks in the universe at the inception of the model, on Jan-2-2000. The Best8(S&P 500 Min-Volatility)-US Tax Efficient This model differs from our Best8(S&P500 Min-Volatility) system with regard to the hedge used and additional sell rules to make holding periods mostly longer than one year so that long term capital gain tax rates would apply. Also a position showing a loss greater than 25% may be sold earlier. All other parameters and ranking system are the same. Under some conditions, such as mergers, a stock will be sold and replaced. This may invoking a short term gain for tax purposes if the holding period was less than one year. The model assumes that stocks are bought and sold at the next day’s average of the Low and High price after a signal is generated. Variable slippage accounting for brokerage fees and transaction slippage was taken into account. Tax Efficiency of the Best8(S&P500 Min-Volatility)-US Tax Efficient An analysis of all the realized trades is shown in Table 1. There were 91 winning stock trades of which 86 had holding periods longer than 1 year. All winning hedge trades had holding periods less than 1 year. The Tax Efficiency was defined as the ratio of total $ gains of winners held longer than 1 year to total $ gains of all winners: 81.4% for this model. By comparison, the Tax Efficiency of the Best8(S&P500 Min-Volatility) system which trades frequently was only 18.6% as shown in Table 2. Since both models show the same annualized return of about 36% it would be more advantageous to follow the Tax Efficient system when trading outside a tax-sheltered account. Performance In the figures below the red graph represents the model and the blue graph shows the performance of benchmark the SPDR S&P 500 Trust ETF ( SPY). Figures 1, 2 and 3 show performance comparisons: Figure 1: Performance 2000-2015 and hedging with short the ProShares UltraPro S&P 500 ETF ( UPRO). Annualized Return= 36.1%, Max Drawdown= -19.8%. The model uses a hedge ratio of 45% of current holdings during down-market conditions. (Note: The inception date of UPRO was June 23, 2009. Prior to this date values are “synthetic”, derived from the S&P 500.) Figure 2: Performance 2000-2015 without hedging. Annualized Return= 21.4%, Max Drawdown= -34.7%. The drawdown figure confirms that minimum volatility stocks perform better than the broader market which had a -55% max drawdown. Figure 3: Performance 2009-2015 with hedging. Annualized Return= 35.8%, Max Drawdown= -17.4%. (click to enlarge) (click to enlarge) (click to enlarge) Figures 4 to 8 show performance details: Figure 4: Performance 2000-2014 versus SPY. Over the 15-year period $100 invested at inception would have grown to $9,889, which is 54-times what the same investment in SPY would have produced. Figure 5: 1-year returns. Except for 2006 the 1-year returns were always higher than for SPY. There was never a negative return in one calendar year. Figure 6: 1-year rolling returns. The minimum 1-year rolling return of the 3-day moving average was -2.9% early in 2008. Figure 7: Distribution of monthly returns. One can see that the monthly returns follow a normal distribution, displaced to the right relative to the returns of SPY. Figure 8: Risk measurements for 15-year and trailing 3-year periods. (click to enlarge) (click to enlarge) (click to enlarge) (click to enlarge) Disclaimer One should be aware that all results shown are from a simulation and not from actual trading. They are presented for informational and educational purposes only and shall not be construed as advice to invest in any assets. Out-of-sample performance may be much different. Backtesting results should be interpreted in light of differences between simulated performance and actual trading, and an understanding that past performance is no guarantee of future results. All investors should make investment choices based upon their own analysis of the asset, its expected returns and risks, or consult a financial adviser. The designer of this model is not a registered investment adviser.
Opportunities In Utilities For Dividend Investors?

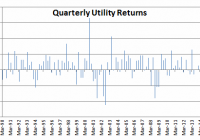
Summary Utilities have produced their worst quarterly returns in 2015 since the financial crisis. Higher interest rates have disproportionately hurt rate-sensitive sectors like utilities. In a relatively fully valued market, the relative underperformance of utilities may present investors an opportunity. The S&P 500 Utility Index, replicated by the Utilities Select Sector SPDR ETF (NYSEARCA: XLU ), has produced a -9.96% return to begin 2015, trailing the S&P 500 (NYSEARCA: SPY ) by over 12%. What has happened? The increase in Treasury yields disproportionately disfavored bond-like stocks with high dividend payouts including utilities and telecom. The trailing dividend yield on the Utilities ETF is now 3.69%. Investors have punished equity sectors with more fixed income-like return streams. After a -5.17% return in the first quarter, the utility index has followed up with a -5.05% return so far in the second quarter. These are the worst returns for the sector since the financial crisis when risk premia on all assets increased as graphed below: Source: Standard and Poor’s; Bloomberg Comparison Versus Bonds For the pounding that interest rate sensitive stocks have taken in 2015, the yield on XLU is still higher than the yield on iShares iBoxx Investment Grade Corporate Bond Index ETF LQD at 3.43%. For the same cash flow stream, I would rather own the equity upside of being a utility shareholder than be the leverage provider by owning their corporate bonds. The -9.96% loss on XLU in the first half has been larger than the -7.54% return on the Barclays Long Treasury Index as proxied by the iShares 20+ Year Treasury Bond ETF (NYSEARCA: TLT ). Conclusion I believe that the utility sector is now relatively cheap, and should be viewed as increasingly attractive to the large Income Investing community on Seeking Alpha. However, I use the term relative as I still expect forward returns on domestic assets to be subnormal . The index I have used as my sector proxy in this article features both gas and electric utilities, fully regulated and a mix of regulated and unregulated business, and features companies located in geographies with different growth trajectories. These utility stocks, at 15.9x trailing earnings, are still collectively trading at a 8% discount to the price Berkshire Hathaway paid for NV Energy in 2013 . Since that purchase in June 2013, the earnings multiple on the broader market has expanded by 13%. Consider this a margin of safety discount to a purchase made by an investor that has a long history of traditionally not paying full sticker price. When Berkshire Hathaway’s ( BRK.A , BRK.B ) MidAmerican Energy Holdings unit bought Pacificorp in 2006, it was reported in Electric Utility Week that Buffett told Oregon regulators that owning utilities was “not a way to get rich – it’s a way to stay rich.” In 2015, utilities have gotten 12% cheaper relative to the rest of the market. Perhaps utilities present dividend-paying investors with long-term horizons an opportunity in a relatively fully valued equity market. Disclaimer: My articles may contain statements and projections that are forward-looking in nature, and therefore inherently subject to numerous risks, uncertainties and assumptions. While my articles focus on generating long-term risk-adjusted returns, investment decisions necessarily involve the risk of loss of principal. Individual investor circumstances vary significantly, and information gleaned from my articles should be applied to your own unique investment situation, objectives, risk tolerance, and investment horizon. Disclosure: I am/we are long SPY. (More…) I wrote this article myself, and it expresses my own opinions. I am not receiving compensation for it (other than from Seeking Alpha). I have no business relationship with any company whose stock is mentioned in this article.

TYO: The Worst Inverse Bond ETF

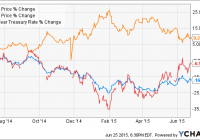
Summary TYO has a high expense ratio. It is illiquid. The ETF is too volatile and does not adequately cover its underlying market. Introduction I have written a number of articles about my favorite inverse bond ETFs. I have also compiled a comprehensive list of the inverse bond ETFs I hate the most. I have discussed these securities extensively over the past few weeks, because I believe we are in an economic environment unavoidably poised to experience rising interest rates. Inverse bond ETFs can be used shrewdly to capitalize on this market inevitability, and they are valuable hedging tools for bond-heavy portfolios. However, there is long list of risks associated with investing in an inverse bond ETF, and it is prudent to research and analyze each security before investing. For this reason, I decided to write an article about the single worst inverse bond ETF on the market, the Direxion Daily 10-Year Treasury Bear 3X Shares ETF (NYSEARCA: TYO ). What Makes an Inverse Bond ETF Bad? When evaluating an inverse bond ETF, it is important for an investor to find a security that has a low expense ratio and correlates well to its underlying index. The three most important metrics for determining the quality of an inverse bond ETF are liquidity, expense, and coverage. A good inverse bond ETF has a low expense ratio, is highly traded, and maintains assets with wide coverage. A bad inverse bond ETF does just the opposite. Another metric that ought to be considered is the strength of the underlying institution that issues the inverse bond ETF. If the institution cannot honor an investment, an investor stands to lose everything. Another factor that ought to be considered is the inverse bond ETFs’ leverage multiple. Inverse Bond ETFs come in three sizes: 1X, 2X and 3X . 2X and 3X ETFs are designed to multiply the returns (or inverse returns) of the daily performance of an underlying index. 1X ETFs follow the daily returns of its underlying index one for one. Since 3X inverse bond ETFs track daily returns by three times, the risks already associated with inverse bond ETFs are exacerbated exponentially. Compounding risk greatly affects the returns of 3X ETFs particularly when tracking range-bound indexes. To read more about the risks of 2X and 3X leveraged ETFs, read my article here . TYO Analysis TYO is the worst inverse bond ETF because its expense ratio is high, it is not highly traded, it does not have wide coverage, and it is triple leveraged (which magnifies the risks associated with investing in it particularly for periods longer than one day). TYO is really the only option for 3X exposure to intermediate-term US Treasury bonds, however, just because it is the only option, does not mean it is a good option. It is the responsibility of issuing institutions to produce a good product that creates its own demand. TYO simply fails in all regards. I included a graph as more of a visual aid to show how TYO works. TYO Performance I included a graph mainly to show how TYO performs relative to its underlying index. The Direxion Daily 10-Year Treasury Bull 3X Shares ETF (NYSEARCA: TYD ) (green) is the 3X bull for 7-10 year Treasury bonds and TYO (orange) is the bear. I also included 10-year Treasury yields to show the correlation between bonds, yields and inverse bond ETFs. From a broad perspective, TYO is well correlated to 10-year yields and provides the results an investor would hope and expect from its underlying index TYD (about .99% correlation). TYO Analysis Continued On the surface, TYO seems to perform the job it is meant to perform. To see how TYO fails, one must examine the security closely. First, TYO’s net expense ratio is very high. The industry average for much more respected and liquid inverse bond ETFs is about 0.9%. Based on TYO’s total assets however, its average competitor has a net expense ratio of about 0.7%. TYO itself boasts one of the highest net expense ratios at 0.95% . What this means is, the investor must pay 0.95% just to hold TYO. The biggest risk of holding TYO, however, is its liquidity risk. It has an average volume of 10,228. TYO’s price is 18.15*10,228=$189,320. Basically, the ETF is off limits to any wealthier investors or money managing firms. Those who hold TYO run the risk of not being able to sell when they want, or causing a drop off in price when attempting to sell large volumes. Either way it’s a huge risk that can be avoided by investing in a more liquid inverse bond ETF. Lastly, TYO only has 49 million in total assets. It does not have an adequate amount of market exposure to fully correlate to changing market conditions. Conclusion The market speaks loudly and prices drive demand. An overpriced inversely leveraged ETF like TYO is going to have very little volume because investors do not want the risk. It is 3X leveraged, so it is designed to be inherently volatile. I can only imagine a poor investor losing money and being unable to sell their shares because no one is buying (or selling). Pick a better, more liquid ETF like the ProShares UltraShort 20+ Year Treasury ETF (NYSEARCA: TBT ) if you are trying to utilize an inversely leveraged ETF. Disclosure: I/we have no positions in any stocks mentioned, and no plans to initiate any positions within the next 72 hours. (More…) I wrote this article myself, and it expresses my own opinions. I am not receiving compensation for it (other than from Seeking Alpha). I have no business relationship with any company whose stock is mentioned in this article.