Tag Archives: applicationid

Smarter Than Smart Beta?

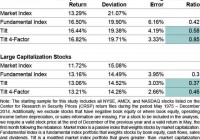
Summary Fundamental Indexation, one popular “smart beta” equity strategy, handsomely outperformed a market-weighted index during the 40 years to December 2014. There is a very pronounced tilt to value in Fundamental Indexation, which weights stocks according to accounting fundamentals rather than by market capitalization. We find that combining market price-based information with fundamental information in a quantitative multi-factor portfolio produces better risk-adjusted performance than either the market or fundamental index. Smarter than Smart Beta? In recent years, smart beta has entered the lexicon of the mutual fund industry and is used to describe certain quantitative investment strategies that aim to beat passive indexes. One of the most popular smart beta strategies is called fundamental indexation. We recently conducted a comprehensive examination of a fundamental indexation strategy using the last 40 years of data and compared this approach to that of two alternative quantitative approaches. The results from the study were revealing. Key findings are outlined below. Fundamentals and Value So what is fundamental indexation? Whereas a traditional passive index such as the Russell 1000 weights stocks by market capitalization, a fundamentals-based index weights stocks according to their accounting fundamentals. So for example, in a market-cap based system, if Apple accounts for 4% of the market cap of the Russell 1000 Index, then it will be assigned a 4% weight. Then, the manager of a fundamental index will increase or decrease Apple’s weight in his index depending on information drawn from Apple’s balance sheet, income statement and statement of cash flows relative to the same accounting information for the other Russell 1000 companies. Proponents of fundamental indexation argue that market-cap weighting will tend to inherently favor high-priced stocks (recall the effects on market-weighted indexes of the tech bubble of the late 1990s) and discriminate against stocks that might be temporarily undervalued. Indeed, the fundamental indexes we constructed in our study for both small cap and large cap stocks handily outperformed their benchmark market indexes during the 40-year period, with lower volatility than the indexes (see “Fundamental Index” in Exhibit 1 below). For this study we assigned index weights, tilting to high fundamentals-to-price stocks (e.g., high book value-to-price), based on the same four accounting factors typically used by fundamental indexers: book equity, along with five-year averages of revenues, operating income before depreciation, and dividends. When we decompose our fundamental indexes, not surprisingly we find a pronounced tilt to value compared to their market cap-oriented indexes, which (given the historical premium for investing in value stocks) helps to explain the excess returns. (click to enlarge) Listening to the Market So far, so good. Now let’s move on to our two alternative approaches, both of which incorporate not only fundamental information but also valuation- or price-based information from the market. In our mind, one weakness of relying exclusively on accounting fundamentals is that they’re stale information (i.e., reported with a lag time). Typically a few months out of date, they also ignore prices and expectations in the market (see Exhibit 2). For a specific example of what I’m talking about, consider the case of Lehman Brothers in the fall of 2008. Lehman started the fourth quarter of 2007 with about $20 billion of book value and, even on the eve of bankruptcy in the fall of 2008, still had close to $18 billion of book value. But by this time the firm’s stock price had collapsed as Lehman was consumed in the financial crisis. A smart beta strategy such as fundamental indexation would not only ignore information in the market price but, because it’s focused solely on the fundamental of book value, would actually signal to double down and buy more Lehman stock. (click to enlarge) So in constructing our two alternative portfolios, we start with the market index and then tilt towards stocks with high fundamental-to-price ratios. For the modified market index (“Tilt” in Exhibit 1), we start with the market index then make tilts using price-scaled information (i.e., fundamental divided by price) from the same four fundamentals that we used in the Fundamental Index. Note that the return and volatility figures for Tilt are very similar to those of Fundamental Index, but that the tracking error and information ratios (NYSE: IR ) are much improved, particularly in the case of small caps. For this study, we chose the IR to measure risk-adjusted portfolio performance (the formula is IR= (Portfolio return – Index return)/Tracking Error). Briefly, tracking error measures divergence from the market index, which by definition has a tracking error of zero (a lower tracking error is better). The IR essentially captures how intelligently different the portfolio’s return is relative to the index (the higher the IR, the better). One reason many portfolio managers and analysts look closely at tracking errors and IR comparisons is due to investor behavior-investors typically seek to beat a market index consistently (a skill that eludes most active fund managers), but get scared if returns swing around wildly and differ dramatically from those of the index. Finally, we studied a four-factor model (“Tilt 4-Factor” in Exhibit 1) that incorporates information from the following four firm characteristics: value, profitability, asset growth, and momentum (for a quick review of factor-based investing, please see my most recent column: ” The Factor-Based Story behind Successful Growth Funds “). Note that this approach combines three so-called slow-moving factors (value, or book equity-to-price; profitability; and asset growth, to which we assign a negative tilt) derived from financial statements with the fast-moving factor of momentum, which reflects price changes for stocks over trailing 12-month periods. We find that this approach, with better factor diversification (e.g., signals from momentum as well as value), produces the best risk-adjusted performance of all, with slightly better returns and lower volatility than for the Fundamental Index and dramatically higher information ratios-twice as high in the case of the small cap stock portfolio. To us, this speaks of the allure of quantitative multi-factor investing, wherein a portfolio manager can combine multiple quantitative insights and improve on a market-based index over extended investment periods. If you would like to learn more about the research I have described in this column, I invite you to read our original study: ” Decomposing Fundamental Indexation .” Conclusion We decomposed fundamental indexation, a leading smart beta investing strategy, during a 40-year period. We find that this modified index has a strong value bent and does indeed outperform the market index by several measurements. But we also find that two alternative portfolio strategies that incorporate market price information generate even stronger risk-adjusted performance results. Disclosure: I/we have no positions in any stocks mentioned, and no plans to initiate any positions within the next 72 hours. (More…) I wrote this article myself, and it expresses my own opinions. I am not receiving compensation for it. I have no business relationship with any company whose stock is mentioned in this article.
Backtesting With Synthetic And Resampled Market Histories

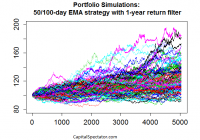
We’re all backtesters in some degree, but not all backtested strategies are created equal. One of the more common (and dangerous) mistakes is 1) backtesting a strategy based on the historical record; 2) documenting an encouraging performance record; and 3) assuming that you’re done. Rigorous testing, however, requires more. Why? Because relying on one sample-even if it’s a real-world record-doesn’t usually pass the smell test. What’s the problem? Your upbeat test results could be a random outcome. The future’s uncertain no matter how rigorous your research, but a Monte Carlo simulation is well suited for developing a higher level of confidence that a given strategy’s record isn’t a spurious byproduct of chance. This is a critical issue for short-term traders, of course, but it’s also relevant for portfolios with medium- and even long-term horizons. The increased focus on risk management in the wake of the 2008 financial crisis has convinced a broader segment of investors and financial advisors to embrace a variety of tactical overlays. In turn, it’s important to look beyond a single path in history. Research such as Meb Faber’s influential paper “A Quantitative Approach to Tactical Asset Allocation” and scores of like-minded studies have convinced former buy-and-holders to add relatively nimble risk-management overlays to the toolkit of portfolio management. The results may or may not be satisfactory, depending on any number of details. But to the extent that you’re looking to history for guidance, as you should, it’s essential to look beyond a single run of data in the art/science of deciding if a strategy is the genuine article. The problem, of course, is that the real-world history of markets and investment funds is limited-particularly with ETFs, most of which arrived within the past ten to 15 years. We can’t change this obstacle, but we can soften its capacity for misleading us by running alternative scenarios via Monte Carlo simulations. The results may or may not change your view of a particular strategy. But if the stakes are high, which is usually the case with portfolio management, why wouldn’t you go the extra mile? The major hazard of ignoring this facet of analysis leaves you vulnerable. At the very least, it’s valuable to have additional support for thinking that a given technique is the real deal. But sometimes, Monte Carlo simulations can avert a crisis by steering you away from a strategy that appears productive but in fact is anything but. As one simple example, imagine that you’re reviewing the merits of a 50-day/100-day moving average crossover strategy with a one-year rolling-return filter. This is a fairly basic set-up for monitoring risk and/or exploiting the momentum effect, and it’s shown encouraging results in some instances-applying it to the ten major US equity sectors, for instance. Let’s say that you’ve analyzed the strategy’s history via the SPDR sector ETFs and you like what you see. But here’s the problem: the ETFs have a relatively short history overall… not much more than 10 years’ worth of data. You could look to the underlying indexes for a longer run of history, but here too you’ll run up against a standard hitch: the results reflect a single run of history. Monte Carlo simulations offer a partial solution. Two applications I like to use: 1) resampling the existing history by way or reordering the sequence of returns; and 2) creating synthetic data sets with specific return and risk characteristics that approximate the real-world funds that will be used in the strategy. In both cases, I take the alternative risk/return histories and run the numbers through the Monte Carlo grinder. Using R to generate the analysis offers the opportunity to re-run tens of thousands of alternative histories. This is a powerful methodology for stress-testing a strategy. Granted, there are no guarantees, but deploying a Monte Carlo-based analysis in this way offers a deeper look at a strategy’s possible outcomes. It’s the equivalent of exploring how the strategy might have performed over hundreds of years during a spectrum of market conditions. As a quick example, let’s consider how a 10-asset portfolio stacks up in 100 runs based on normally distributed returns over a simulated 20-year period of daily results. If this was a true test, I’d generate tens of thousands of runs, but for now let’s keep it simple so that we have some pretty eye candy to look at to illustrate the concept. The chart below reflects 100 random results for a strategy over 5040 days (20 years) based on the following rules: go long when the 50-day exponential moving average (NYSEMKT: EMA ) is above the 100-day EMA and the trailing one-year return is positive. If either one of those conditions doesn’t apply, the position is neutral, in which case the previous buy or sell signal applies. If both conditions are negative (i.e., 50-day EMA below 100 day and one-year return is negative), then the position is sold and the assets are placed in cash, with zero return until a new buy signal is triggered. Note that each line reflects applying these rules to a 10-asset strategy and so we’re looking at one hundred different aggregated portfolio outcomes (all with starting values of 100). The initial results look encouraging, in part because the median return is moderately positive (+22%) over the sample period and the interquartile performance ranges from roughly +10% to +39%. The worst performance is a loss of a bit more than 7%. The question, of course, is how this compares with a relevant benchmark? Also, we could (and probably should) run the simulations with various non-normal distributions to consider how fat-tail risk influences the results. In fact, the testing outlined above is only the first step if this was a true analytical project. The larger point is that it’s practical and prudent to look beyond the historical record for testing strategies. The case for doing so is strong for both short-term trading tactics and longer-term investment strategies. Indeed, the ability to review the statistical equivalent of hundreds of years of market outcomes, as opposed to a decade or two, is a powerful tool. The one-sample run of history is an obvious starting point, but there’s no reason why it should have the last word.

Bill Gross: It Never Rains In California

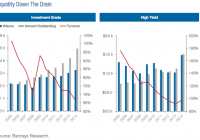
Ted Cruz recently suggested praying for rain in Texas, and apparently someone did a few weeks ago, producing a deluge resembling a modern day Noah’s Ark of sorts. California’s Governor Brown on the other hand, has taken a more secular approach. He believes that Mammon, not God, bears responsibility for the Golden State’s record drought and that I, we, all of us simple folk should cut back water usage by a minimum of 25%. Well it’s hard to argue with Governor Moonbeam especially when it comes to the environment, although if you ask me, his other idea of hundreds of miles of high speed rail at a minimum cost of $25 billion is off the rails and on the governor’s private moon. But I will do my part. As a free citizen though, I have choices: replace the lawn with artificial grass, take fewer showers, jerry-rig the toilet bowl, or perhaps eat fewer almonds. I will choose a diet of fewer almonds. Growing almonds it seems, consumes 10% of all the annual residential water supplied to 40 million thirsty folks in California, and 60% of that production is exported, so I suggest we fight the drought “there” as opposed to “here”, if you get my drift. To that same point, an article in the impeccably objective Wall Street Journal claims that the water consumption for one pound of almonds is equivalent to 50 five minute showers, so I’m not giving up my shower for a bag of almonds. It’s here, though, where I have to do a little bragging. Some people will talk about having the world’s greatest dog or their newborn baby who slept through the night during the first week. But Sue and I have something very different. We have the world’s greatest shower. To be quite candid, it’s not the water, the temperature, the simple knobs, or even the shower head that makes it the best; nor is it the combination of all four. The key to our shower in fact, is not the actual experience of hot water on a 98.6° body at all. It’s the view; our shower has the world’s greatest view. The scenery from it is so gorgeous that when we sell our home, we may list the shower separately and see if it attracts an offer higher that the rest of the house. If not, we’ll just sell the house with a shower “easement” and continue to come in and out from the street every morning at 6:00 a.m. Back to the view. That it has one in the first place is, I suppose, outrageous in and of itself. But here Sue and I were in 1990, constructing our house on a Laguna Beach cliff overhanging more white water than you could shake a kayak at. The sailboats were drifting by, the surfers were hanging ten and it seemed like every minute of every waking day should be focused on that gorgeous piece of the Pacific that comes to rest 60 feet below our bathroom. So we built a shower with a window – not a picture window – but one big enough for a view. As is customary with a new home, I carried Sue over the threshold on the first day we moved in. But once the workers had cleared out, we headed straight for the shower. “Champagne?” she asked. “Nah”, I said romantically. “Just wanna look at the view.” When it comes to retirement, I don’t think we’ll need our 401Ks. We’ll just sell tickets to our shower, and use the proceeds to pay for some of Governor Moonbeam’s almonds. Speaking of liquidity, whether it be in surplus in a Laguna Beach shower, or an extreme deficit in the State of California, current concerns in the financial markets center around the absence of liquidity and the effect it might have on future market prices. In 2008/2009, markets experienced not only a Minsky moment but a liquidity implosion, as levered investors were forced to delever. Ultimately the purge threatened even the safest and most liquid of investments. Several money market funds appeared to “break the buck” which in turn threatened the $4 trillion overnight repo market – the center core of our current finance-based economy. Responding to this weakness, the Fed and other central banks imposed emergency liquidity provisions of their own – in effect they became the buyers of last resort. Recently however, Congressional legislation concerning “too big to fail” and Federal court rulings in favor of AIG regarding the expropriation of shareholders’ capital, have cast doubts as to whether central banks and their governments can exercise similar “puts” in the future to stabilize asset prices. As a result, regulators are proceeding with “better safe than sorry” mandates – tightening bank capital standards, curtailing the size of the potentially volatile repo market from $4 to $2 trillion, and pursuing inquiries as to which financial institutions are “strategically important” – code for “big enough to threaten asset market stability”. Not only major banks but several insurance companies and asset managers including PIMCO – just one block down the street – are being scrutinized. These individual companies which include Prudential, MET, BlackRock, and at least several others have responded as you might expect. “No problem” sums it up – markets are a little less liquid they claim, but recent experience would show that for PIMCO at least, there were no “fire sales” or “forced selling” after my recent departure, as stated by CEO Doug Hodge in a friendly WSJ article. Ah, now I’ve caught your interest. Well first of all let me state that the PIMCO example is not a good one to use to prove the current liquidity of mutual funds, ETFs, and even index funds. Hodge himself admitted to internal proprietary “liquidity” provisions, adding that it used derivatives for exposures “to support cash buffers and inflows” (sic). The fact is that derivatives on a systemic basis represent increased leverage and therefore increased risk – presenting possible exit and liquidity problems in future months and years. Mutual funds, hedge funds, and ETFs, are part of the “shadow banking system” where these modern “banks” are not required to maintain reserves or even emergency levels of cash. Since they in effect now are the market, a rush for liquidity on the part of the investing public, whether they be individuals in 401Ks or institutional pension funds and insurance companies, would find the “market” selling to itself with the Federal Reserve severely limited in its ability to provide assistance. While Dodd Frank legislation has made actual banks less risky, their risks have really just been transferred to somewhere else in the system. With trading turnover having declined by 35% in the investment grade bond market as shown in Exhibit 1, and 55% in the High Yield market since 2005, financial regulators have ample cause to wonder if the phrase “run on the bank” could apply to modern day investment structures that are lightly regulated and less liquid than traditional banks. Thus, current discussions involving “SIFI” designation – “Strategically Important Financial Institutions” are being hotly contested by those that may be just that. Not “too big to fail” but “too important to neglect” could be the market’s future mantra. Down the street from PIMCO, I must openly acknowledge that helping to turn Janus into one of these “too important” companies is one of my objectives, as it is for CEO Dick Weil. But that day lies ahead of us. For now, regulators and thus large institutional asset managers are at least contemplating an inability to respond to potential outflows. Just last week Goldman Sachs’ Gary Cohn cleverly suggested that liquidity is always available at “a price”. True enough in most cases, except perhaps for 1987 when stock markets declined 25% in one day as the vaunted portfolio insurance scheme met its maker due to sellers all rushing to the exit at the same time. Aside from the obvious drop in trading volumes shown above, the obvious risk – perhaps better labeled the “liquidity illusion” – is that all investors cannot fit through a narrow exit at the same time. But shadow banking structures – unlike cash securities – require counterparty relationships that require more and more margin if prices should decline. That is why PIMCO’s safe haven claim of their use of derivatives is so counterintuitive. While private equity and hedge funds have built-in “gates” to prevent an overnight exit, mutual funds and ETFs do not. That an ETF can satisfy redemption with underlying bonds or shares, only raises the nightmare possibility of a disillusioned and uninformed public throwing in the towel once again after they receive thousands of individual odd lot pieces under such circumstances. But even in milder “left tail scenarios” it is price that makes the difference to mutual fund and ETF holders alike, and when liquidity is scarce, prices usually go down not up, given a Minsky moment. Long used to the inevitability of capital gains, investors and markets have not been tested during a stretch of time when prices go down and policymakers’ hands are tied to perform their historical function of buyer of last resort. It’s then that liquidity will be tested. And what might precipitate such a “run on the shadow banks”? A central bank mistake leading to lower bond prices and a stronger dollar. Greece, and if so, the inevitable aftermath of default/restructuring leading to additional concerns for Eurozone peripherals. China – “a riddle wrapped in a mystery, inside an enigma”. It is the “mystery meat” of economic sandwiches – you never know what’s in there. Credit has expanded more rapidly in recent years than any major economy in history, a sure warning sign. Emerging market crisis – dollar denominated debt/overinvestment/commodity orientation – take your pick of potential culprits. Geopolitical risks – too numerous to mention and too sensitive to print. A butterfly’s wing – chaos theory suggests that a small change in “non-linear systems” could result in large changes elsewhere. Call this kooky, but in a levered financial system, small changes can upset the status quo. Keep that butterfly net handy. Should that moment occur, a cold rather than a hot shower may be an investor’s reward and the view will be something less that “gorgeous”. So what to do? Hold an appropriate amount of cash so that panic selling for you is off the table. A wise investor from nearly a century ago – Bernard Baruch – counseled to “sell to the sleeping point”. Mimic Mr. Baruch and have a good night.