Tag Archives: applicationid

The Smarter Investor

“}); $$(‘#article_top_info .info_content div’)[0].insert({bottom: $(‘mover’)}); } $(‘article_top_info’).addClassName(test_version); } SeekingAlpha.Initializer.onDOMLoad(function(){ setEvents();}); By Chris Bennett Investors have spoken: There is a world outside of traditional indexing, and they want in. “Smart beta” or factor indices bridge the gap between active and passive management by allowing investors to tilt toward specific investment attributes – for example, low volatility or high dividend yield. These indices use factors in a rules-based, transparent manner to determine index composition and/or weighting. Smart beta products give passive investors access to factor exposures that were once only available through active management. Smart beta has flourished, attracting more assets than ever before. According to our 2014 Survey of Indexed Assets , AUM in products linked to S&P DJI smart beta indices grew 55% in 2014. As the demand for factor indices has increased, so has their availability. We’ve created indices to provide a wide variety of exposures, while still maintaining the advantages of passive management. The growth of ETFs as a delivery vehicle has complemented the growth of factor indices, enabling investors to seek new opportunities. That said, the demand for smart beta has not been cannibalistic; passive investment in traditional exposures has also increased . AUM growth in products indexed to the S&P 500 outpaced the growth of the index, indicating positive net flows into traditional cap-weighted investments . The demand for first-generation indexed investments has not decreased in the wake of new “smart” offerings. Much research ( including our SPIVA reports ) confirms that most active managers underperform most of the time. The probability that an active manager beat his benchmark is low, and the probability that he does it consistently is even lower . Positive inflows into passive vehicles indicate that investors have heeded these data, and that the smarter investor prefers better odds . Disclosure: © S&P Dow Jones Indices LLC 2015. Indexology® is a trademark of S&P Dow Jones Indices LLC (SPDJI). S&P® is a trademark of Standard & Poor’s Financial Services LLC and Dow Jones® is a trademark of Dow Jones Trademark Holdings LLC, and those marks have been licensed to S&P DJI. This material is reproduced with the prior written consent of S&P DJI. For more information on S&P DJI and to see our full disclaimer, visit www.spdji.com/terms-of-use . Share this article with a colleague
Using Profitability As A Factor? Perhaps You Should Think Twice…

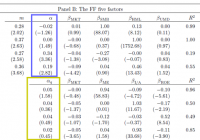
By Wesley R. Gray, Ph.D. Many investors are getting excited about the so-called ” profitability factor ,” originally posed by Novy-Marx (here is an alternative story ). Larry Swedroe has a high-level piece advocating the concept here . The basic idea is simple: Other things being equal, firms with high gross profits (revenue – costs) have earned higher expected returns than firms with low gross profits. Even market heavyweights Eugene Fama and Ken French have integrated the factor into their new ” 5-factor model ,” which consists of a market factor, size factor, value factor, profitability factor, and an investment factor. This research was not lost on Dimensional Fund Advisors (DFA), a massive quantitative asset manager that is essentially an extension of University of Chicago Finance Department. DFA has added the concept of profitability to their process (we assume it is the profitability factor identified by Fama and French). In the words of Eduardo Repetto, DFA’s CIO, regarding profitability: New research has to be very robust, very reliable and have real information that’s not already captured in the other dimensions. But how robust is the so-called profitability factor? Is it possible that the profitability factor might already be captured in other dimensions? A new paper entitled, “A Comparison of New Factor Models,” by Kewei Hou, Chen Xue, and Lu Zhang, shows that the profitability factor is not, in fact, a new “dimension,” as has been suggested. The authors find that the profitability factor highlighted by Fama and French is captured in cleaner ways by their simpler and more robust 4-factor model, which consists of a market factor, a size factor, an investment factor, and a return-on-equity factor. The authors highlight that there are “four concerns with the motivation of the Fama and French model based on valuation theory,” suggesting that the factors chosen by Fama and French are merely descriptive and/or data-mined, but not grounded in economic theory. Ouch. But the critique of the 5-factor model isn’t only on theoretical grounds, it is also based on the evidence. The Hou, Xue, and Zhang 4-factor model captures all the returns associated with the new factors outlined by Fama and French. Note the alpha estimates below. The yellow box highlights the alphas associated with the FF factors, controlling for the Hou, Xue, and Zhang factors, and the blue box highlights the alphas associated with the Hou, Xue, and Zhang factors, controlling for the FF factors. The Hou, Xue, and Zhang factors can explain the FF factors, but the FF factors cannot explain the Hou, Xue, and Zhang factors. This suggests that the “new” profitability factor may not be a new dimension at all, since it can be explained via exposures to the market, size, and Hou, Xue, and Zhang’s investment and ROE factors. (click to enlarge) The results are hypothetical results and are NOT an indicator of future results and do NOT represent returns that any investor actually attained. Indexes are unmanaged, do not reflect management or trading fees, and one cannot invest directly in an index. Additional information regarding the construction of these results is available upon request. Profitability is also questionable in international markets. In a working paper, ” The Five-Factor Fama-French Model: International Evidence ,” by Nusret Cakici, the author looks at the performance of the five-factor model in 23 developed stock markets. There is only marginal evidence the factor works globally. In some markets, the factor is effective, but in other regions such as Japan and Asia-Pacific, the factor simply doesn’t explain returns. Our own internal research on the matter is consistent with this result. Concluding remarks regarding the profitability factor A lack of unified results often hints towards a lack of robustness and/or data-mining. Only time will tell if the out-of-sample performance of the so-called profitability factor will hold. There are certainly a lot of smart academics and investment houses leveraging the factor as a way to capture higher returns, so we can’t rule anything out. However, our advice is to tread lightly in the factor jungle, being sure to always carry a heavy machete to chop away at noisy data and the overfitting problems that accompany them. Original Post

Estimating Worst Case SWRs For Modern Portfolios

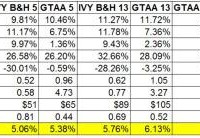
One of the challenges in dealing with modern portfolios like the Permanent Portfolio, the various IVY portfolios, Risk Parity portfolios, etc is the lack of long term historical data. Most of the modern portfolio data for a broad range of asset classes only goes back to 1973. The period from 1973 onward obviously only represents a subset of historical economic and financial conditions. This represents quite a challenge when looking forward and trying to model probable future outcomes for different portfolios. In the context of retirement this fact makes determining SWRs for modern portfolios difficult. The worst case historical 30 year retirement period that determines the SWR for the 60/40 US stock US bond portfolio began in 1966 . Fortunately, 1966 is not that far from 1973 which gave me an idea for estimating SWRs for modern portfolios as if they existed from 1966. Just use the 60/40 return data to for the modern portfolios from 1966 to 1972, then the modern portfolio return data going forward to estimate an SWR for these portfolios. This should give a conservative estimate for historical SWRs form these portfolios which is an apples to apples comparison to the SWR from the classic 60/40 portfolio, aka the famous 4% rule. Let’s see where this process takes us. In previous posts I had presented a variety of statistics for modern portfolios; returns, standard deviations, and SWRs. I also pointed out that the SWRs from these calculations had to be taken with a huge grain of salt. The retirement periods from 1973 onward, when the data for the modern portfolios begins, do not encompass the worst case period in history to retire, the 30 year period starting in 1966. The SWRs for periods starting in 1973 would be significantly higher than for those starting in 1966. In order to get an estimate of what SWRs for modern portfolios would have been going back to 1966 I simply took the historical return series for each of the modern portfolios and used the return data from the 60/40 portfolio from 1966 to 1972 for each portfolio. This will yield a conservative estimate of the modern portfolio SWRs going back to 1996. The assumption here of course is that the modern portfolios would have performed better than the 60/40 portfolios from 1966 to 1972. I think that’s a pretty safe assumption. Below is a table of the results along with the other portfolios stats that I updated through 2014. I did not do this exercise for all the portfolios I track just the ones I discuss the most often on the blog. First, all the portfolio stats in the table are for the period from 1973 to 2014, the actual performance of the portfolios. It is only for estimating the SWRs that I inserted the 1966 to 1972 60/40 return data. I labeled that line 1966 SWRs to make that distinction. As the 1966 SWR line shows, even with the initial 7 year (1966 to 1972) equal performance to the 6o/40 portfolio all of modern portfolios have significantly higher SWRs than the classic 60/40 or even 70/30 US stock US bond buy and hold portfolio. The more broadly diversified buy and hold portfolios, IVY B&H 5, IBY B&H 13, and the Permanent Portfolios have estimated 1966 SWRs ranging from 5.06% to 5.76%. The portfolios that add simple downside risk management (via the 10 month SMA) – the GTAA5 and GTAA 13 portfolios have 1966 SWRs of 5.36% and 6.13% respectively. GTAA 13 also adds value and momentum factors to the mix. Then the portfolios that have diversification, downside risk management, value and dual momentum factors have the highest 1966 SWRs of all. The Antonacci dual momentum portfolios, GEM and GBM, have 1966 SWRs of 5.71% and 5.68%. The aggressive IVY momentum portfolios, AGG6 and AGG3 lead the bunch with SWRs of 7.95% and 8.63% respectively. Pretty impressive all the way around even after handicapping the modern portfolios with 60/40 returns from 1966 to 1972. In summary, modern portfolios have significantly higher SWRs than the classic 4% SWR rule suggests. Even in the forecasted poor return scenarios that I’ve discussed before these portfolios will most likely perform much better than the classic portfolio that the original 4% SWR was based on. Does that mean that these estimated historical SWRs can be used for investors starting to withdraw from portfolios today? Possibly but I wouldn’t go so far as that. As the infamous disclaimer goes, past returns are no guarantee of the future. All we can do is put the odds in our favor. Being the conservative sort, I base my investment allocations on one or more of these modern portfolios but still stick the 4% SWR rule. Then I adjust SWRs accordingly maybe every 3-5 years. Regardless, the superior nature of the modern portfolios, not just in terms of SWRs, should be considered by all investors. Note: There is a lot of information about modern portfolios to glean from all of the portfolio stats in the above table for investors withdrawing from portfolios and even of investors still in the wealth building phase. Just look at the differences in returns/risk and long term wealth for these modern portfolios vs the most often recommended 60/40 buy and hold portfolio. The fact that the 60/40 portfolio is still the most common allocation for US investors is kind of crazy when you see these results.