Tag Archives: applicationid

Sky High Valuations? Lusterless Economy? It Just Doesn’t Matter!

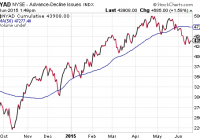
Sky high stock valuations do not matter in an era of worldwide central bank rate manipulation. And yet, there are a few things that may still carry weight with the global investing community as we move forward in 2015. The way that I view it, the appeal of all risk assets in the large-cap universe had shot out of a cannon in the first half of 2013. In 2015, however, the S&P 500 A/D line has flattened out. Several years ago, Rolling Stone ranked the 10 best movies by former cast members of Saturday Night Live. Bill Murray barely made the list with Rushmore – an offbeat comedy from the late 90s. I remember thinking that Murray had been cheated in the editorial; he should have received additional nods for Caddyshack, Stripes, Lost In Translation as well as What About Bob. In that vein, how on earth did they miss the quintessential camper experience from my youth, Meatballs? Granted, Meatballs did not have the critical acclaim of Lost in Translation or the monumental influence of Caddyshack; the writer may not have been alive in the 70s. Nevertheless, Meatballs had one of the most iconic quasi-motivational speeches ever. Murray’s character, head counselor Tripper Harrison, persuades a band of misfit teens to take on the elite athletes from another camp by celebrating nonconformity. Here’s a snippet from the inspirational talk: Murray (Tripper Harrison): Even if every man, woman and child held hands together and prayed for us to win, it just wouldn’t matter, because all the really good looking girls would still go out with the guys from Mohawk ’cause they’ve got all the money! It just doesn’t matter if we win or we lose. Campers and Counselors: IT JUST DOESN’T MATTER! IT JUST DOESN’T MATTER! IT JUST DOESN’T MATTER! Thirty six years since the release of Meatballs, I find my mind drifting back to Bill Murray’s humorous exchange with his dejected campers. (In some ways, he may have been speaking directly to movie-goers.) I address legitimate concerns about risk assets regularly. And yet, sky high stock valuations do not matter in an era of worldwide central bank rate manipulation. I chronicle the good, the bad and the ugly about the economy daily. And still, it just doesn’t matter to the risk-on herd. For example, it has been well-documented that the price-to-book (P/B), price-to-sales (P/S) and P/E) of the median stock on U.S. exchanges have never been higher. Not even during the dot-com craziness in March of 2000. Similarly, U.S. stock market value as a percentage of gross national product is at 150%; that represents the second highest level in U.S. history. Warren Buffett wrote in 2001 that when one buys stocks in the 70%-80% range, the decision is likely to work out well. At present, the “Buffett Indicator” is 2x preferred levels. Does it matter? Not in the immediate term. What about the economy that has been lumbering along at a 2% clip for six-and-a-half years? Those sub-par growth results in the recovery required extraordinary emergency measures of $3.75 trillion in asset purchases by the Federal Reserve System; it also required federal government excess spending of $7.5 trillion. More recently, industrial production – a measure of output for manufacturers, miners and utilities – dropped 0.2% in May and has not increased since November of last year. The Federal Reserve Bank of New York’s Empire State manufacturing survey registered a negative reading (-2.0) in June – its second negative report in the last three months. Does it matter? Not particularly. In contrast, there are a few things that may still carry weight with the global investing community as we move forward in 2015. For instance, the evidence surrounding the potential for a disorderly exit by Greece from the euro suggests that markets may struggle a bit more than most media pundits are willing to acknowledge. More importantly, recent downshifts in market breadth have convinced me that a defensive allocation is warranted. Keep in mind, when investors are gaga for risky assets, they often acquire them across the board. Yet both the NYSE and the S&P 500 have seen a definitive breakdown in the number of advancers compared with the number decliners. The NYSE Advance Decline Line (A/D) has not been this far below its near-term 50-day moving average since the October swoon and the November “Bullard Bounce.” The S&P 500 is also losing some if its participants in the rally. Throughout May and June, less and less of component companies are moving higher in established uptrends. During highs that were established over the last six months, bullish breadth readings clocked in near 75%. Bullishness via the Bullish Percentage Index (BPI) for the S&P 500 is about as weak as it was in February. We can even take a look at the slope of the advance/decline line for the S&P 500. The way that I view it, the appeal of all risk assets in the large-cap universe had shot out of a cannon in the first half of 2013. And while the desire tapered off a bit between the 2nd half of 2013 and the end of 2014, the passion was still there. In 2015, however, the S&P 500 A/D line has flattened out. Granted, the benchmark can still move higher with less and less corporate shares participating; market-cap weighted indexes concentrated in the “Apples” will do that. On the flip side, weakening breadth can also mark a turning point such that stocks will move dramatically higher or dramatically lower. Indeed, we have been approaching a critical crossroads. The Federal Reserve is deciding whether to begin a campaign of tightening borrowing costs slightly or to wait for definitive data that is unlikely to ever confirm genuine economic strength. More importantly, what the Fed actually does will be far less important than the interpretation by the global investing community. The Fed might raise rates 0.125% at a 2015 meeting that is so slow, risk-takers would likely celebrate; the Fed might raise overnight lending rates 0.25% while simultaneously expressing that they won’t do so again until three months of upbeat data. Conversely, the Fed could misread the signals by simply hiking borrowing costs on the belief that the economy is healthy enough to withstand the heat, spiking volatility in treasuries as well as equities. Or, they might sound so downbeat in their assessment, stocks could flounder on recessionary fears. In other words, different things matter at different times. Keep an eye on the iShares 7-10 Year Treasury Bond ETF (NYSEARCA: IEF ). If the price of IEF climbs above and stays above its 200-day moving average, it may suggest that fears of Fed rate hikes were overblown. Stocks would likely benefit from contained borrowing costs. In contrast, if IEF stays below its 200-day and drops significantly below its June low near 104, expect corrective activity for riskier stock assets. Click here for Gary’s latest podcast. Disclosure: Gary Gordon, MS, CFP is the president of Pacific Park Financial, Inc., a Registered Investment Adviser with the SEC. Gary Gordon, Pacific Park Financial, Inc, and/or its clients may hold positions in the ETFs, mutual funds, and/or any investment asset mentioned above. The commentary does not constitute individualized investment advice. The opinions offered herein are not personalized recommendations to buy, sell or hold securities. At times, issuers of exchange-traded products compensate Pacific Park Financial, Inc. or its subsidiaries for advertising at the ETF Expert web site. ETF Expert content is created independently of any advertising relationships.
The Little Worm That Is Destroying Capitalism

By Jason Voss, CFA In response to the Great Recession, central banks continue to engage in massive monetary stimulus to artificially depress the costs of capital. Many commentators have expressed concerns (and I concur) about the inflationary forces they believe must naturally be building up because of this stimulus. Yet, very few commentators have discussed the consequential little worm that is destroying capitalism, and the mindset thus birthed. Costs of Capital Generations of business schools have taught – and business leaders have implemented – capital budgeting philosophies based on expected rates of returns and weighted average cost of capital (WACC). First, cash flows over a time horizon are estimated for a proposed project. On the positive cash-flow side, these may include additional revenues created or future expenses saved. Either way, there is some benefit to a business of the proposed project. Netted against these benefits are the negative cash flows – the expenses – that are expected to be incurred to implement the project. Next, the net flows over time are discounted by the WACC, and the assumed risks of successfully implementing the project are built into this discount rate. If the net present value (NPV) of this calculation is positive, then businesses are supposed to proceed with the project. Still, others prefer to compare their expectations for internal rate of return (IRR) to the WACC. Either way, the process is the same. The Little Worm But this entire framework has a problem – the little worm that is destroying capitalism, albeit slowly. Namely, in calculating cost of debt and cost of equity for businesses, market-based rates are used, and with the misnamed “risk-free rate” serving as the root of all other costs of capital. What happens though when central banks’ loose monetary policy creates too much capital and artificially holds down root costs of capital? Companies adjust their required rates of return down, too. In fact, one could argue that this is a principal reason for why central banks are holding root costs of capital so low: to spur business investment. Yet when WACC is held artificially low, many projects are accepted that previously would never have been considered viable under normal circumstances. Put another way, the problem is using relative values – not absolute values – in calculating costs of capital. Examples of such projects providing marginal benefits are: improving financial reporting systems through better information technology, minor tweaks to supply chain logistics, cutting back on marketing or increasing low-cost advertising (like social media), “rationalization” of head count, holding average wages as low as possible, squeezing suppliers a little bit, not repatriating earnings to stave off taxation, refinancing rather than retiring debts, and the share buyback that is insensitive to a company’s current stock price. I could go on. It is not that these marginal WACC projects are unworthy and shouldn’t be done, it is that the lifeblood of capitalism is creative destruction. It is fiery and intense. Capitalism is supposed to be more like a volcano than a hot plate keeping the coffee warm! Evidence that the worm is eating away at capitalism is that revenues continue to grow much more slowly than do earnings per share (EPS) . Furthermore, revenues continue to miss consensus estimates even though EPS continue to beat estimates. Also, EPS continue to grow so quickly due mostly to a shrinking denominator (i.e., big share buybacks). Ask yourself: When was the last time you heard genuine risk-taking behavior on the part of your portfolio of businesses? I think you will agree that only a handful of companies are engaged in proper game-changing capitalistic risk taking. Normalized Cost of Capital In the developed nations, I estimate a normalized long-term project after-tax WACC of around 6.5%, versus an estimated late 2014 WACC of only 3.0%. Even if you disagree with my estimates, I believe if you calculate your own, you will find that current costs of capital are about less than half of a normalized figure. That means you should expect at least 100% more projects being approved than under normal cost of capital scenarios. Yet this high figure may actually understate the number of excess projects being funded. This is because as cost of capital asymptotically approaches zero (i.e., ” to negative nominal yields and beyond!” ), the actual number of projects thought of as viable may follow a power law distribution instead of behaving linearly. In other words, businesses are currently in the process of destroying what was, once upon a time, a precious resource to be conserved: capital. A Remedy? If you agree with me, I propose, as a simple remedy, that costs of capital for a business begin to be evaluated on an absolute, normalized basis, rather than on a relative basis. And, I would add, treating externalities as free/not considering economic, social, and governance (ESG) is not going to cut it either. As a shareholder – or prospective shareholder – you do not need to wait for a company to engage in this behavior. Instead, you can begin to use normalized costs of capital in your own estimates of fair value. This may shrink your universe of investible assets, so be wary of diversification being worse. Fear the Worm My big fear is that even once costs of capital begin to rise/normalize, a generation of gutless business leaders is being hatched in the current gutless business culture. In short, artificially low costs of capital are eroding the capitalist’s risk-taking, return-generating mindset. Yikes! In conclusion, which company would you rather invest in: the one using normalized costs of capital in capital budgeting, or the company just using traditional methods? Thought so! Disclaimer: Please note that the content of this site should not be construed as investment advice, nor do the opinions expressed necessarily reflect the views of CFA Institute.

How To Choose Between VOO And SPY

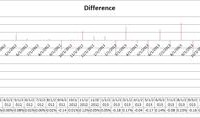
Summary The Vanguard S&P 500 ETF has a strong correlation to SPDR’s S&P 500 ETF. Despite the very strong correlation in returns, there is a clear way to pick which ETF is a better investment. The difference is more than expense ratios. The fund underperforming in one month regularly outperforms in the next using dividend adjusted close values. Investors in the Vanguard S&P 500 ETF (NYSEARCA: VOO ) have plenty of reasons to be happy with their investment. The fund tracks a reasonably stable portion of the U.S. economy and offers investors a lower expense ratio than a major competitor, the SPDR S&P 500 Trust ETF (NYSEARCA: SPY ). The ratio isn’t substantially lower, but the difference is meaningful if the investment horizon is long enough. For VOO the expense ratio is .05% and for SPY it is .09%. The difference should imply that VOO would outperform over the long term by increasing the compound annual growth rate by about .04%. The difference isn’t huge, but it does add up over time. The correlation Returns between the two ETFs have an extremely high correlation, over 99.9%. The strong correlation in returns gives investors reason to believe that the two ETFs should move almost perfectly in unison. However, there are occasionally meaningful differences in the share price of the two major ETFs and those differences result in opportunities for investors. Looking back I ran some regression on returns since the start of October 2010. Since then, the Vanguard S&P 500 ETF has largely mirrored the SPDR S&P 500 ETF. Both were up between 94.1% and 93.6% and the movements generally occur at almost precisely the same time. The interesting thing was when I decided to track the differences in the dividend adjusted closes for each month. The premise is that for each month I would look at the returns on VOO and subtract the returns on SPY. This gave me the difference in the percentage return for the month. I put together a chart to demonstrate, but the volume of data points may make it a little difficult to read. (click to enlarge) What investors should notice is that the bars are regularly trading direction. Not only do the bars swing back and forth, the longest bars going in any direction are precisely between two bars heading in the opposite direction. When the bars are fairly short, it provides little indication of which way the bars will move in the future. The theory My prediction upon glancing at the numbers was that we should expect to see serial negative correlation in the difference of the returns. In simpler words, we should expect the two ETFs to move together and treat any deviation from that connection as an error by the market. When one ETF has meaningfully outperformed the other in the previous month, the one with weaker performance should be purchased. I tested that by running a correlation between the difference for each month and the difference reported in the next month. If my theory was correct, there should be a negative correlation. The test showed a negative correlation of 35.7% (rounded). With a decent sample size, I’m comfortable taking that as confirmation. In my opinion, the deviations in the market value of these two ETFs can be used as a clear indication on which ETF investors should be buying if they are investing with a time frame of a few years. If the time frame is multiple decades If investors are planning to buy and hold the shares for a few decades, the difference in expense ratios should overwhelm the regression between the two ETFs and I would expect VOO to provide slightly superior returns over the next 20 or 30 years due to the difference in expense ratios. Conclusion Vanguard S&P 500 ETF is a great investment for keeping up with the S&P 500 over the long time. It offers a lower expense ratio than SPY and very similar returns. When the time frame is measured in months or only a couple of years, investors may want to look at the recent difference in returns and choose the ETF that has seen weaker share price performance since there is a very solid history of the differences in performance reversing over the following month. For investors that can trade VOO without commissions, the benefit of removing commissions could eliminate the short term advantages of investing in the fund with a weaker short term history. However, that depends entirely on the share volume trading hands. If there was a meaningful movement in price between the two ETFs, I would expect the weaker one on average to capable of outperforming by about .10% in the following month. For the investor contemplating investing in VOO and capable of trading it without commissions, the most attractive time to do so is when it has just fallen short of SPY. If we assume SPY is the most accurate gauge of the movement in the economy, then any time that VOO becomes cheaper relative to SPY is a time when the ETF is more attractive to purchase. It doesn’t matter if SPY moved up or down last month, it simply matters whether VOO underperformed SPY. Disclosure: The author has no positions in any stocks mentioned, and no plans to initiate any positions within the next 72 hours. (More…) The author wrote this article themselves, and it expresses their own opinions. The author is not receiving compensation for it (other than from Seeking Alpha). The author has no business relationship with any company whose stock is mentioned in this article. Additional disclosure: Information in this article represents the opinion of the analyst. All statements are represented as opinions, rather than facts, and should not be construed as advice to buy or sell a security. Ratings of “outperform” and “underperform” reflect the analyst’s estimation of a divergence between the market value for a security and the price that would be appropriate given the potential for risks and returns relative to other securities. The analyst does not know your particular objectives for returns or constraints upon investing. All investors are encouraged to do their own research before making any investment decision. Information is regularly obtained from Yahoo Finance, Google Finance, and SEC Database. If Yahoo, Google, or the SEC database contained faulty or old information it could be incorporated into my analysis.