Tag Archives: alt-investing

What The $2.1 Billion Transaction Means For NextEra Energy Partners

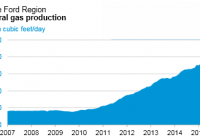
Summary The company only holds renewal energy assets right now. Pipelines are backed by long-term contracts that should provide sustainable cash flow. However, when we look at the entire company as a whole, this acquisition adds little value. NextEra Energy Partners (NYSE: NEP ) is a company formed by NextEra Energy (NYSE: NEE ) to acquire and manage contracted clean energy projects with long-term cash flows. Through a controlling general partnership interest and a 22.2% limited partnership interest in the operating company, NEP OpCo., the company owns a portfolio of solar and wind power generating assets. Given the existing assets, it may come as a surprise to you that the company recently announced a $2.1 billion acquisition, consisting of solely natural gas pipelines. Let’s learn a bit more about this transaction. The Transaction The acquisition includes seven natural gas pipelines located in Texas. The pipelines currently have capacity of 4 Bcf per day with 3 Bcf already contracted with ship-or-pay contracts. So right off the bat we can see that there is growth potential without additional capital spending. While utilization seldom reaches 100%, the current rate of 75% clearly has additional room for improvement. The management also mentioned that is already an expansion project underway and would be providing an additional 1 Bcf of volume per day. This brings the total growth organic growth potential of these pipelines to 67%. The locations connected by the major pipelines are also interesting, let’s take a closer look. The two largest pipelines are the NET Mexico Pipeline and the Eagle Ford Pipeline. Both of them deliver gas from the Eagle Ford Shale to Mexico. What is the significance of the Eagle Ford Shale? It is one of the most prolific unconventional plays in the U.S. Despite the recent commodity crash, we did not see a significant decline (see following chart from the EIA). Source: eia.gov As long as production does not stop, the company can keep its utilization rate up. To make things better, the pipeline is also under a 20 year ship-or-pay contract meaning that the company would receive payments even if production falls. To put the cherry on top, it is also the lowest-tariff transmission pipeline from Eagle Ford to Mexico. The Eagle Ford Pipeline is similar to the NET Mexico Pipeline. They both provide a cost advantageous way for production companies to transport gas to Mexico. Synergy? Although I feel that the pipelines are great and will deliver long-term cash flows to the company. I do not think that there is any synergy between this acquisition and any of the current renewal energy assets held. Now the management would have to deal with another source of risk (i.e. commodity risk). Despite the long term nature of the pipelines, ultimately their profitability will be dependent on the success of producers. No contract can protect the company if producers start to go bankrupt left and right. Although this is not an immediate concern (yet), it is still another drawback. Conclusion The assets acquired are excellent when you look them by themselves. They provide a source of long-term cash flow through decades long contracts and attractive locations. However, when you look at the entire company as a whole, there seems to be little benefit to the existing renewable portfolio. Disclosure: I/we have no positions in any stocks mentioned, and no plans to initiate any positions within the next 72 hours. (More…) I wrote this article myself, and it expresses my own opinions. I am not receiving compensation for it (other than from Seeking Alpha). I have no business relationship with any company whose stock is mentioned in this article. Share this article with a colleague

Trading Volatility: The Hunt For Disaster Is The New Gold Rush

Summary Lessons from the original Gold Rush. Trading volatility on the long side is rarely profitable. Time, math and yourself are your enemies when you are long volatility. The Original Gold Rush On January 24th, 1848, James Marshall, a carpenter out of New Jersey, found gold flakes in the American River at the base of the Sierra Nevada mountains in California at a sawmill owned by John Sutter. Word spread of the gold finding and storekeeper Sam Brannan set off a frenzy when he paraded through San Francisco with a vial of gold obtained from Sutter’s Creek. At the time, the population of California was 6,500 Mexicans and 700 Americans (not counting Native Americans). By mid-June, 75% of the male population of San Francisco left town for the gold mines and the number of miners reached 4,000 by August of 1848. Throughout 1849, people around the United States (mostly men) borrowed money, mortgaged their property or spent their life savings to make the arduous journey to California. By the end of 1849, the non-native population of California ballooned to 100,000 with San Francisco establishing itself as the central metropolis of the new frontier. This invasion of the 49ers promptly lead to California’s admission to the Union as the 31st state. By 1850 (1 year later) surface gold in California largely disappeared even as miners continued to arrive. Mining is a difficult and dangerous labor and striking it rich requires good luck as much as skill and hard work. You have to be able to canvas a large territory, pick at various locations and if they don’t produce, abandon them immediately for the next opportunity. While most gold miners didn’t succeed in getting rich from gold mining, California’s economy got off the ground and the by end of the 1850’s California’s population was north of 380,000 with a bustling economy. The Hunt For Disaster Is The New Gold Rush Trading volatility on the long end is very much like gold mining. The opportunities are very few and far in between, but when they come, they can make you money quick. The ProShares Ultra VIX Short-Term Futures ETF ( UVXY) has had the following streaks since its inception in October of 2011 (these streaks are on closing basis): As you can see, if you took the same amount and invested it with just the perfect timing and got in at the bottom and got out at the top, you would have made 800%+ in about 280 days. On average about 50% return for each winning streak which lasts about 19 days. 50% return in 3 weeks? I would take that anytime. There have been 15 winning streaks since October of 2011 or about 1 streak per quarter. But therein lies the promise and curse of the Long Volatility Trade. While the returns can be spectacular while volatility is rising, it takes a lot of waiting for the moment to come when you can strike. Only 20% of the time does UVXY rise. Only every 3 weeks out of 3 months do we get an opportunity to make a good UVXY trade. 80% of the time UVXY goes down and it plunges head first. Since its inception, the fund is down 99.99% . If you bought and held UVXY since inception and you invested $1,000,000, you right now have about a $1. That’s right, $1 for your efforts! I mean if you are going to do that, go to Vegas and at least get some free drinks. The Psychology of Being Long Volatility In 2014, after having made some good money on being short volatility in 2012 and 2013, I decided to take a portion of the winnings in the VelocityShares Daily Inverse VIX Short-Term ETN ( XIV) and go on a psychedelic world tour through the dark side. I knew full well the statistical percentages and the pain I am about to experience, but like playing with fire, you don’t really know your physiological limitations until you experience it firsthand. I wanted to experience trading pain and ultimate ecstasy via the UVXY. The neural points that are triggered during a winning trading experience release higher quantities of serotonin (happy neurotransmitter) and as such explain the addiction to hopeless trading. So I decided to be very disciplined and have a rock solid stop-loss discipline, as I knew I’ll be on the bad side of the trade most of the time so I have to cut my losses short quickly. In the beginning I did exactly that. Starting in April of 2014, I made about 10 trades, in and out, 5% stop. But the losses started to add up. May 2014 didn’t provide a drawdown. 10 trades with 5% loss, by June I had only half the capital. Still knowing that I can hit 100% pretty quickly and recover my losses, I stayed in. June, July, August. Waiting and waiting for the right moment. Finally September came and provided the draw I was looking for. But at that point, I had been burned so many times over the past 4 months, I was now more wary and judicious. The first draw came and I missed it. I then waited for a quick rip and went long UVXY again. Another move down, boom. Made 50% on the trade. But then when we nearly hit the 10% drawdown, I decided to double down. If this had gone 10% down, it’s surely heading to 20% and that is when the big money in UVXY happens. The panic after the panic. And very briefly the futures completely collapsed over night on October 15th below every technical support. I am on my way to big money. Finally! But by the morning a sharp reversal came overnight, magically the futures went from 30 down to positive by the open, the HFT algos then took it and pushed it higher. I stayed in thinking that this was just a 1-2 day bounce. But not only was it not a bounce, it was a heart stopping rip. In 3 days, it rallied 80 points. The double on the UVXY position was down 50% just like that and the original profit was now completely gone. I stayed a couple of more days hoping for another dip to bail on better terms, but a dip was not to be. V shaped snap back usually found near bear market bottoms just happened at the top of a bull market 5 years strong. It was a major shorts carnage. Never happened before, but it happened now. That was the final nail on my UVXY adventure. With pretty much 85% of the capital lost, with my stop-loss discipline in tatters by the methodical pounding of UVXY’s relentless losses, betrayed by the worthless hope of high percentage returns, I quit the experiment. It’s ok to experience pain here and there, but this is simply well-refined torture. The medieval inquisition would be proud. Disaster may be fascinating, but it is a waste of time So while it is very tempting to trade disaster, disaster in fact happens only rarely and the losses far outweigh the gains. We are all drawn to disaster. There is nothing more exciting that to watch a well-designed and complex system fall apart. As an engineer or an analyst, you can love nothing more. You get to see how all the pieces interact, how these interactions malfunction, how the different pieces themselves malfunction. It’s like performing a surgery. It’s very educational. But we need not intermingle our fascination with disaster with our trading. It is a very expensive proposition. If you want to avoid disaster, go to cash, gold, something stable and ride out the moment. Trading it for profit is fool’s gold. The iPath S&P 500 VIX Short-Term Futures ETN ( VXX) and UVXY – do not touch with a 10-foot pole. Forget they even exist. Just go back to the world prior to 2009, when they didn’t exist. If I was the NASDAQ, I would require Option Level 2 approval before letting people trade those two instruments. Just stay out. Disclosure: I am/we are long XIV. (More…) I wrote this article myself, and it expresses my own opinions. I am not receiving compensation for it. I have no business relationship with any company whose stock is mentioned in this article.
Best And Worst Q3’15: Telecom Services ETFs, Mutual Funds And Key Holdings

Summary Telecom Services sector ranks seventh in Q3’15. Based on an aggregation of ratings of six ETFs and 12 mutual funds. PBS is our top-rated Telecom Services ETF and FWRLX is our top-rated Telecom Services mutual fund. The Telecom Services sector ranks seventh out of the 10 sectors as detailed in our Q3’15 Sector Ratings for ETFs and Mutual Funds report. It gets our Dangerous rating, which is based on an aggregation of ratings of six ETFs and 12 mutual funds in the Telecom Services sector. See a recap of our Q2’15 Sector Ratings here. Figure 1 ranks all five ETFs and Figure 2 ranks the five best and worst mutual funds in the sector that meet our liquidity standards. Note that even the best Telecom Services ETFs fail to earn an Attractive-or-better rating. Not all Telecom Services sector ETFs and mutual funds are created the same. The number of holdings varies widely (from 23 to 55). This variation creates drastically different investment implications and, therefore, ratings. Investors should not buy any Telecom Services ETFs or mutual funds because none get an Attractive-or-better rating. If you must have exposure to this sector, you should buy a basket of Attractive-or-better rated stocks and avoid paying undeserved fund fees. Active management has a long history of not paying off. Figure 1: ETFs with the Best & Worst Ratings – Top 5 (click to enlarge) * Best ETFs exclude ETFs with TNAs less than $100 million for inadequate liquidity. Sources: New Constructs, LLC and company filings The SPDR S&P Telecom ETF (NYSEARCA: XTL ) is excluded from Figure 1 because its total net assets are below $100 million and do not meet our liquidity minimums. Figure 2: Mutual Funds with the Best & Worst Ratings – Top 5 (click to enlarge) * Best mutual funds exclude funds with TNAs less than $100 million for inadequate liquidity. Sources: New Constructs, LLC and company filings The Rydex Series Telecommunications Fund (MUTF: RYMIX ) (MUTF: RYMAX ) (MUTF: RYCSX ) is excluded from Figure 2 because its total net assets are below $100 million and do not meet our liquidity minimums. The PowerShares Dynamic Media Portfolio ETF (NYSEARCA: PBS ) is the top-rated Telecom Services ETF and the Fidelity Select Wireless Portfolio (MUTF: FWRLX ) is the top-rated Telecom Services mutual fund. PBS earns a Dangerous rating and FWRLX earns a Neutral rating. The ProShares Ultra Telecommunications ETF (NYSEARCA: LTL ) is the worst-rated Telecom Services ETF and the Rydex Telecommunications Fund (MUTF: RYTLX ) is the worst-rated Telecom Services mutual fund. Both earn a Very Dangerous rating. 43 stocks of the 3000+ we cover are classified as Telecom Services stocks, but due to style drift, Telecom Services ETFs and mutual funds hold 55 stocks. Inteliquent Inc. (NASDAQ: IQNT ), on the Most Attractive Stocks List in July , is one of our favorite stocks held by Telecom Services ETFs and mutual funds and earns our Very Attractive rating. Since 2007, Inteliquent has grown after-tax profit ( NOPAT ) by 24% compounded annually. In addition to strong profit growth, the company improved its return on invested capital ( ROIC ) to 28% from 11% in 2012. Despite the strong underlying business performance, IQNT remains undervalued. At its current price of $18/share, Inteliquent has a price to economic book value ( PEBV ) ratio of 1.1. This ratio implies that the market expects NOPAT to grow by 10% from its current level. If Inteliquent can grow NOPAT by 7% compounded annually for the next decade, the stock is worth $24/share today – a 33% upside. Cincinnati Bell, Inc. (NYSE: CBB ) is one of our least favorite stocks held by Telecom Services ETFs and mutual funds and earns our Very Dangerous rating. Over the past five years, Cincinnati Bell’s NOPAT has declined by 19% compounded annually. Even worse, Cincinnati Bell has failed to create shareholder value by failing to generate positive economic earnings for 11 consecutive years. Despite years of poor business fundamentals, CBB is overvalued. To justify its current price of ~$4/share, Cincinnati Bell must grow NOPAT by 9% compounded annually for the next 12 years. Owning this stock and, ergo, betting on the company to pull off such an extended turnaround given its recent struggles is quite risky. Figures 3 and 4 show the rating landscape of all Telecom Services ETFs and mutual funds. Figure 3: Separating the Best ETFs From the Worst ETFs (click to enlarge) Sources: New Constructs, LLC and company filings Figure 4: Separating the Best Mutual Funds From the Worst Mutual Funds (click to enlarge) Sources: New Constructs, LLC and company filings D isclosure: David Trainer, Kyle Guske II, and Max Lee receive no compensation to write about any specific stock, sector or theme. Disclosure: I/we have no positions in any stocks mentioned, and no plans to initiate any positions within the next 72 hours. (More…) I wrote this article myself, and it expresses my own opinions. I am not receiving compensation for it. I have no business relationship with any company whose stock is mentioned in this article.