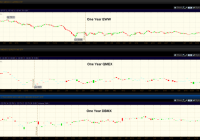
A currency hedged version of a long established fund. A carefully weighted fund through the use of a 25/50 ‘capping methodology’. The fund selects from the full range of Mexican companies: small, medium and large caps. The iShares Currency Hedged MSCI Mexico ETF (NYSEARCA: HEWW ) is the most recent of Mexico focused funds, having been incepted on June 29, 2015. Since the fund has been trading only a few weeks, it offers no real return metrics to compare. However, by examining a nearly identical fund, the fund’s allocation, the structure of the Mexican economy and the relative stability of the Mexican Peso, the interested investor will have a gauge of the future potential of the fund. Name and Symbol Description Inception iShares Currency Hedged MSCI Mexico Tracks the MSCI Currency Hedged IMI Mexico 25/50 Capped Index June 29, 2015 SPDR MSCI Mexico Quality Mix ETF (NYSEARCA: QMEX ) Tracks the Total Return performance of the MSCI Mexico Quality Mix A-Series Index September 17, 2014 Deutsche X-trackers MSCI Mexico Hedged Equity ETF (NYSEARCA: DBMX ) Tracks the MSCI 25/50 U.S. Dollar Hedged Index January 23, 2014 iShares MSCI Mexico Capped ETF (NYSEARCA: EWW ) Tracks the MSCI unhedged IMI Mexico 25/50 Capped Index Data from iShares, SPDR, DeutschebankMarch 12, 1996 (Data from iShares, SPDR, Deutschebank) The new fund tracks the Morgan Stanley Capital International Indices (MSCI) Mexico Investible Market Index (IMI) 25/50 100% U.S. Dollar Hedged Index . According to the prospectus , the fund is passively managed. The fund is ‘capped’: it is a capitalization weighted index . The 25/50 ‘capping methodology’ means that no single issue exceeds 25%. All issues with a weight above 5% do not cumulatively exceed 50% of the underlying index weight. The index includes large, mid and small cap companies. (click to enlarge) (Data from iShares, SPDR, Deutschebank) The careful investor is sure to ask how necessary is it to have a currency hedge? There’s a clear answer to this question. In a nutshell, central banks are obligated to maintain a stable currency. Having a too strong or too weak currency will create negative effects on any economy. For example, the usual way for a central bank to slow inflation is to raise short term interest rates. However, this runs the risk of slowing the economy too much; something the recently emerged Mexican economy would not want to do. Banco de Mexico has come up with an innovative solution. It regularly auctions U.S. Dollars from its currency reserves. This enables the central bank to strengthen the currency by reducing the supply of Pesos in the economy, while at the same time maintaining sustainable lending rates. Because of the scope and scale of the top global reserve currency U.S. Dollar, Mexico’s export product prices to the U.S. are hardly affected. However, large swings in relative currency values could negatively impact the dollar value conversion of a portfolio, a Mexican focused fund for instance, even though the portfolio’s fundamentals are unchanged. (Data from iShares) As mentioned above, HEWW has just recently been listed for trading. Fortunately, there’s a way to accurately gauge market performance by examining the identical but ‘unhedged’ capped index fund, the iShares MSCI Mexico Capped ETF and compare that with other Mexico focused funds. It was a simple matter to download the holdings of each fund to a spreadsheet, alphabetizing them and then comparing entry by entry. Indeed the holdings of EWW and HEWW are identical with the exception that the dollar hedged fund has positions for currency forward contracts, naturally. (Data from iShares) There are two other funds for comparison. DBMX also tracks the MSCI 25/50 capped index, although it omits a consumer discretionary and a financial holding which occur in the iShares funds. QMEX tracks about half of the companies in the 25/50 capped index, 34 in total, along with two others not listed in the 25/50 capped index. QMEX also holds a position of liquid U.S. Dollars reserves. Fund Net Assets (millions) Shares Outstanding Number of Holdings Average Volume Premium to Discount Expense Ratio P/E Equity Beta 12 month Trailing Yield EWW $1479.953 26,100,000 60 734,113 0.00% 0.48% 31.11 1.09 1.62% DBMX $4.5399 200,001 57 2,621 0.29% 0.50% 17.7 0.76 2.79% QMEX $2.44 100,000 33 224 -0.16 0.40% 22.99 1.61 1.43 (Data from iShares, SPDR, Deutschebank) Investing in a country focused fund is essentially investing in the overall economy. So a basic understanding of what drives the Mexican economy is needed. As mentioned, Mexico has an export economy and it’s clear from the chart below, it is heavily dependent on its NAFTA partner U.S. economy. (Data from iShares) Bilateral trade with the U.S. is just over $500 billion comparable to bilateral U.S.-Canadian trade of about $600 billion. In total, bilateral trade with both Canada and the U.S. well exceeds trade with any other individual nation; however, Mexico has other large regional partnerships and free trade agreements. The Mexican government has focused on building an extensive free trade network. Nearly 90% of Mexico’s global trade transacts through free trade agreements. According to the Secretariat of Economy, other free trade partnerships in force exist with Australia, Korea, Singapore, Israel, India and the European Free Trade Association. Mexico is a participant in the future Trans-Pacific Partnership. In the America’s, aside from NAFTA, Mexico has free trade agreements throughout Latin America, South America and with Cuba. The point of the matter is that even though Mexico’s largest trading partner is the U.S.; Mexico has an extensive free trade network outside of North America. The Mexican economy has been affected by the collapse of global oil prices. However, Mexico is not a petro-economy. Surprisingly, 14% of total power production is derived from renewable resources: 11% from hydro plants and 3% from geothermal and biomass, according to U.S. EIA data. The government is expanding wind generation projects including plants on the Baja peninsula for power exports to the U.S. Mexico is a net exporter of crude petroleum, producing about 2.5 million bbl of crude oil per year and consuming about 2 million bbl; the remainder is exported. Mexico has proven reserves of 9.8 billion bbl, approximately. Mexico is a net importer of natural gas, producing about 1.64 billion ft 3 consuming almost 2.3 billion ft 3 . Lastly it is a net importer of coal, mining 16.7 million tons and consuming 20.7 million tons. What it adds up to is that the economy is somewhat affected by global petroleum markets, but it is certainly not totally dependent on volatile global petroleum markets. (Data from iShares) In the recent downturn in global oil prices, the government responded accordingly by reducing government spending, which is about 0.7% of GDP. The Ministry of Finance estimates GDP growth to be within the range of 2.2% to 3.2% in 2015; 2.9% to 3.9% for 2016. The Bank of Mexico expects inflation to remain at the 3% target rate. The important point is that the fiscally responsible government is doing a good job keeping inflation very close to the target, keeping the Peso stable and maintaining slow but steady growth. As it stands now, an increase in demand from the U.S. will bode well for the Mexican economy. To be sure, Mexico has many domestic and international concerns which must be solved. However, while negative news might make attention getting headlines, those headlines obscure the years of positive achievements of the Mexican government and Banco de Mexico since the currency crises of 1994-1995. Those achievements include maintaining a sustainable inflation rate and a stable currency in spite of a global credit crisis, still reverberating in Europe and Asia. Also, the Ministry of Trade has done a remarkable job in establishing what might be the most comprehensive ‘free trade network’ in the world. In the private sector, banks are well capitalized and regulated. Industry isn’t just manufacturing but also includes research and development with global partners. Unhedged EWW Returns After 1 Year After 3 Years After 5 Years After 10 Years Since Inception 3/12/1996 Total -14.14% -0.73% 5.00% 9.48% 11.46% Market Price -14.45% -1.08% 5.04% 9.41% 11.43% Benchmark Index -13.86% -0.73% 4.75% 9.03% 12.12% (Data from iShares, SPDR, Deutschebank) According to iShares the currency hedged ETF H EWW fund has net assets of $2,466,407. The expense ratio is rather high at 1.10%; however, there is a ‘fee waiver’ which results in an expense ratio of 0.51%. The fund is virtually identical to the long established iShares EWW fund with the addition of a currency hedge. To sum up, several Mexico focused funds have been created over the past two years. This most recent addition is virtually identical to the long established iShares Mexico Capped ETF. Recently, the returns reflect the still recovering global economy but returns of EWW since inception are respectable. Naturally, the investor must choose between competing funds, however, upon close examination, the brand new iShares currency hedged fund actually has a long established track record. Disclosure: I/we have no positions in any stocks mentioned, and no plans to initiate any positions within the next 72 hours. (More…) I wrote this article myself, and it expresses my own opinions. I am not receiving compensation for it (other than from Seeking Alpha). I have no business relationship with any company whose stock is mentioned in this article. Additional disclosure: “CFDs, spread betting and FX can result in losses exceeding your initial deposit. They are not suitable for everyone, so please ensure you understand the risks. Seek independent financial advice if necessary. Nothing in this article should be considered a personal recommendation. It does not account for your personal circumstances or appetite for risk.”

