Baby Boomers: LEAP Into Action
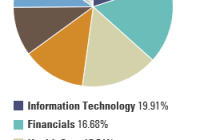
Summary The U.S. equity markets are currently very dangerous. Baby Boomers may not have time to recoup following another crisis. Buying long-dated put options (LEAPS) to hedge market exposure is prudent. Warning signs abound indicating we are at, or very near, the top in this market. This is the time to play defense, and we like the idea of increasing portfolio protection through long-term put options, referred to as LEAPS (Long-Term Equity AnticiPation Securities) on the SPDR S&P 500 ETF (NYSEARCA: SPY ). The opportunity to hedge broad market exposure all the way out to December 2017 is currently not possible for ETFs tracking the other major indices – only for the SPY, which tracks the S&P 500. At the end of the article, we’ll discuss the specifics of the idea. Why Boomers? Estimates say that about 75 million Baby Boomers are on the verge of retiring, and that 10,000 new boomers retire every single day. This rate is expected to continue for the next twenty years. Since Baby Boomers are generally classified as those born between 1946 and 1964 (or roughly of ages 51-69), if there is a severe and sustained market correction over the next few years, which seems highly probable to us, it will be very difficult to make back substantial losses without the benefit of a very long-time horizon. To make matters worse, many retired boomers could be forced to try and re-enter the workforce, competing against Millennials, a generation who will have surpassed boomers in size by that time. The good news is that Boomers who are still working have presumably caught the lion’s share of the equity market boom over the last twenty years, which is probably nicely reflected in the balance of some type of retirement account (401(NYSE: K ) or IRA). Here are a few legs of the Boomer’s retirement “chair” (Note: We are purposely excluding Social Security, as that debacle is for another article entirely). Defined Contribution Plans Defined contribution plans in the U.S. had total assets of $5.7 trillion at the end of 2013 , and are surely over $6 trillion by now. This accounts for roughly a quarter of all U.S. fund assets. The 401 is the most common of these defined contribution plans. According to Fidelity , as of Q1 2015, the average 401 balance is around $91,800, but they go on to say that if you’ve been in your 401 plan for 10 years or more (probably a Boomer), the balance goes up to $251,600. Combine (i) unprecedented employer matching; (ii) compounding of the returns; and (iii) a once-in-a-lifetime bull market with the fact that you are soon exiting the workforce as reasons to consider hedging the substantial gains you have. Unfortunately, the investment options for the DC plans we’ve seen are limited and cookie-cutter, with little thought, if any, given to downside protection. Although the sponsors do occasionally offer changes to the investment options, they usually are dangerously trend-following. The closest thing to perceived safety is probably a generic government fixed income fund, which, in our opinion, offers little safety. You’ll be lucky to even have a money market fund included as an option, and the one you have is probably full of terms like “enhanced” or “prime”, which is full of repos and commercial paper that is thought of as safe, but isn’t – all to squeeze out another tenth of a percent in return. IRAs Many boomers, especially those on Seeking Alpha, have a brokerage account somewhere, whether a standard brokerage account or an individual retirement account (IRA). IRAs (traditional or ROTH) offer more flexibility than other types of retirement accounts (like a 401, where the plan’s mutual funds are usually the only investment options). If you have an IRA or regular brokerage account, you probably have the ability to purchase options (you may have to fill out a form or two), which can serve as a hedge for your nest egg that may be held in place with limited choices (like the 401). Pensions If you have a pension, there is, unfortunately, a reasonable assumption that you can expect future benefit cuts, especially after the next severe market downturn. We sincerely hope we are wrong about this, but believe you should be prepared that we’re right. Pension funds have been the end-buyers of all the worst investments that have come across the last few years – covenant-lite junk bonds, leveraged loans and every conceivable “asset”-backed product that underwriters can devise, all in an effort to meet unrealistic return assumptions to match unrealistic promises (future obligations). Pension funds have been passing off some of their risk to insurers, but if MetLife’s (NYSE: MET ) quarterly report is any indication, even insurers may be realizing they’re taking on too much market risk (and that’s saying something). In its latest quarterly update, MetLife suggested it’s taking on less pension risk transfers. If this trend continues, pensions won’t be able to pass off this risk, and their assets should get severely impaired. But I’m Diversified Already You may technically be “diversified” in different mutual funds, ETFs or even asset classes, but your risk is not necessarily reduced because of it. Even though your defined contribution plan may be spread out among several different funds (high-yield bond funds, emerging market funds, small cap stocks, dividend growth, etc.), these correlations all converge towards 1 in a financial crisis, so the SPY hedge will hedge out some of the risk (but not all). But why SPY? A Quick Background The SPDR S&P 500 ETF , issued by BlackRock (NYSE: BLK ), is an exchange-traded fund that seeks to track the broad S&P 500 index. SPY is currently comprised of 505 (not 500, who knew?!) of the largest domestic companies in the U.S., and is one of the most widely held and liquid securities in existence today. The fund’s current breakdown by its largest sectors is, roughly, technology (20%) financials (16%), and healthcare (16%). The remainders are listed below: Our Concerns The SPY is not quite as top-heavy as other top ETFs, like the PowerShares NASDAQ 100 (NASDAQ: QQQ ) but it is still quite dangerous, really dominated by three sectors – technology, financials and healthcare. As you can see, the technology sector makes up the largest portion of the SPY, at about 20%. Like QQQ, the top two holdings of SPY are Apple (NASDAQ: AAPL ) and Microsoft (NASDAQ: MSFT ). We have expressed serious concern with the technology sector in an article last week, where we offer a “Quick Recap” section at the end with six specific reasons why we’d avoid or hedge exposure to the tech sector. The second-largest sector in the SPY is financials, which we think is in trouble, and we wrote an article on the SPDR Select Sector Financial ETF (NYSEARCA: XLF ) reflecting that opinion a couple weeks ago. We expressed concerns for SPY’s #6 holding, Wells Fargo (NYSE: WFC ), and feel the housing market recovery is now in trouble. Some data points have come out since that article, hinting at the slowdown. On Wednesday, we saw June pending home sales dip 1.8% in June from the month prior, breaking a streak of five consecutive “up” months. We also have seen mortgage applications continue to stagnate. Wells is also the largest auto lender, and this area is a source of real concern and should provide ample supply of litigation for regulators going forward. And you can’t talk about regulations without mentioning JPMorgan (NYSE: JPM ). In Thursday’s Wall Street Journal , there was an article talking about how big banks, including JPM and Goldman Sachs (NYSE: GS ), were encouraging their hedge fund clients to purchase derivatives (total return swaps) instead of buying and selling the regular underlying stocks to circumvent capital limits imposed by regulators (there’s the next round of future litigation). Next up is healthcare (at almost 16%), where we see an M&A-fueled frenzy for the health insurers culminating in Anthem’s (NYSE: ANTM ) purchase of Cigna (NYSE: CI ) for $48 billion, besting Aetna’s (NYSE: AET ) purchase of Humana (NYSE: HUM ) just three weeks earlier. Similar action can be seen in the biotech sector, which is full of stocks that are way overhyped and overextended, and we don’t ever recall this amount of coverage in the biotech space. The frenzy may have been “justified” to this point , as many of these companies have created wonderful drugs for many people. But we wrote specifically on concerns with the biotech stocks last month. Many of these stocks represent all the upside that “growth” stocks can offer, and little of the downside. History shows that when the growth story goes away or sentiment shifts on stocks that have had outrageous runs, the pain for shareholders is severe. International Exposure According to a Bloomberg article, companies in the S&P 500 derive roughly 46% of their revenues from overseas. This is a real concern, since you’ll get the worst of both worlds going forward. With China, you see how fast credit deflation can affect an equity market. All the repercussions haven’t trickled through yet, outside of maybe the commodities complex, but they certainly will. A chart on the front page of USA Today this week showed that there might be much more to come for those exchanges, as their moves uncannily mirrored the Nasdaq dotcom bubble. The eurozone is still a mess, of course, and emerging markets should continue to underperform as a strengthening dollar (recently hitting parity) implodes their dollar-denominated debt that they’ll never be able to repay or refinance. When the credit gets turned off here our market could have a similar result, given our levels of margin debt (82% higher than at the peak in 2000). We are a credit-based economy, and our stock markets’ run of the last few years has been fueled by credit and easy money policies – both of which are ending. Weak Market Internals Volume has been slow for years during this recovery (even more so if you take out buybacks). The narrow advances can clearly be seen in the major technology names, but it’s present in the broader market as well. The chart below, created by John Hussman, incorporates four metrics: (i) a market making, or nearing, a new all-time high (making it actionable); (ii) fundamental overvaluation (as captured in the Shiller P/E), stemming from; (iii) historic bullish sentiment extremes (bull/bear polls), combined with; (iv) deteriorating internals (stocks trading relative to their 200-day moving averages). We are witnessing another period where these are all occurring in tandem, and you can see on the chart instances of these occurrences in prior periods: Here’s another chart recently from J. Lyons Fund Management that details the McClellan Oscillator to illustrate the current level of weak market internals using NYSE Advance-Decline and New Highs and Lows data. This threshold was recently met, and in prior occurrences, according to the table below, the S&P 500’s median returns for the subsequent two years shows a 21.6% loss (we added the notes regarding an SPY hedge). (click to enlarge) We agree with this bearish sentiment, and think the S&P 500 will lose at least a quarter of its value over the next couple of years, which will put the S&P 500 back just below 1600 (if that sounds far-fetched, recall that just last fall, the S&P 500 was at 1820). This would bring the market back to the peak levels of March 2000 and October 2007, which will turn into “support” (we hope). LEAP into Action We believe the best choice is to take advantage of the low volatility currently offered in the market, because it won’t be here for much longer. The VIX, currently 12.10, tracks the implied volatility of S&P 500 options. This level is very low, in our opinion, especially when you take into account what could be looming in the future. Volatility is a key component in option prices, and when the VIX spikes, you’ll get the added benefit. An investor can hedge out broad market exposure for almost 2½ years by buying the December 2017 SPY put options. We like the $200 strike price, with a last sale of $19.28 (the SPY closed today, Thursday, at $210.82, so this option is slightly out of the money). But round number contracts normally garner the most liquidity, and this contract is no exception, with 9537 contracts in its open interest – larger than any other contracts in the chain. We expect this number to increase as the SPY is one of the go-to securities that institutions will turn to for hedging. Remember, a put option gives the buyer the right to sell a security at a fixed price for a period of time. This put option will go up in value if the underlying security (in this case the SPY, or S&P 500, i.e. “the market”) goes down, which should offset the losses to underlying holdings (mutual funds, stocks, ETFs, etc.) in a portfolio. Overall liquidity and option volumes have increased since the financial crisis, as options have become more mainstream. Many platforms at firms such as Charles Schwab (NYSE: SCHW ), E-Trade (NASDAQ: ETFC ) and TD Ameritrade (NYSE: AMTD ) have volumes of educational material on the use of options to help reduce risk in a portfolio. There are several option strategies that are used to generate income, but we suggest keeping it simple with our long-dated put option. If the market continues to rip higher over the next 2½, your portfolio will benefit and your options will expire. But even a partial hedge is better than no hedge at all. You purchase insurance for many other facets of your life, so adding “your financial future” to that list is appropriate (and responsible), especially with the market levels we currently see. Resist the natural temptation to do nothing . Boomers can’t afford to sustain losses at this stage, since making it back will be that much more difficult, if not impossible. Disclosure: I/we have no positions in any stocks mentioned, and no plans to initiate any positions within the next 72 hours. (More…) I wrote this article myself, and it expresses my own opinions. I am not receiving compensation for it (other than from Seeking Alpha). I have no business relationship with any company whose stock is mentioned in this article. Additional disclosure: This article is for informational purposes only and is not a recommendation to buy or sell any security and I/we are not registered investment advisors. Option trading has several risks, including, but not limited to, illiquidity and counterparty risk. Options are not suitable for all investors and you should always consult your financial advisor for suitability in accordance with your individual situation.