Tag Archives: alt-investing

Best And Worst Q3’15: Information Technology ETFs, Mutual Funds And Key Holdings

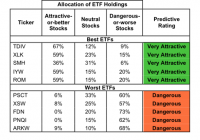
Summary Information Technology sector ranks second in Q3’15. Based on an aggregation of ratings of 28 ETFs and 129 mutual funds. TDIV is our top-rated Information Technology ETF and ROGSX is our top-rated Information Technology mutual fund. The Information Technology sector ranks second out of the 10 sectors as detailed in our Q3’15 Sector Ratings for ETFs and Mutual Funds report. It gets our Neutral rating, which is based on an aggregation of ratings of 28 ETFs and 129 mutual funds in the Information Technology sector as of July 9, 2015. See a recap of our Q2’15 Sector Ratings here . Figures 1 and 2 show the five best and worst-rated ETFs and mutual funds in the sector. Not all Information Technology sector ETFs and mutual funds are created the same. The number of holdings varies widely (from 23 to 397). This variation creates drastically different investment implications and, therefore, ratings. Investors seeking exposure to the Information Technology sector should buy one of the Attractive-or-better rated ETFs or mutual funds from Figures 1 and 2. Figure 1: ETFs with the Best & Worst Ratings – Top 5 (click to enlarge) * Best ETFs exclude ETFs with TNAs less than $100 million for inadequate liquidity. Sources: New Constructs, LLC and company filings Figure 2: Mutual Funds with the Best & Worst Ratings – Top 5 (click to enlarge) * Best mutual funds exclude funds with TNAs less than $100 million for inadequate liquidity. Sources: New Constructs, LLC and company filings The First Trust NASDAQ Technology Dividend Index ETF (NASDAQ: TDIV ) is the top-rated Information Technology ETF and the Red Oak Technology Select Fund (MUTF: ROGSX ) is the top-rated Information Technology mutual fund. Both earn a Very Attractive rating. The ARK Web x.0 ETF (NYSEARCA: ARKW ) is the worst-rated Information Technology ETF and The Rydex Internet Fund (MUTF: RYINX ) is the worst-rated Information Technology mutual fund. ARKW earns a Dangerous rating and RYINX earns a Very Dangerous rating. 527 stocks of the 3000+ we cover are classified as Information Technology stocks. Cisco Systems, Inc. (NASDAQ: CSCO ), a previous Stock Pick of the Week, is one of our favorite stocks held by TDIV and earns our Very Attractive rating. Since 2005, Cisco has grown after-tax profit ( NOPAT ) by 6% compounded annually. Cisco earns a top-quintile return on invested capital ( ROIC ) of 16% and has steadily become a free cash flow machine, generating $9.5 billion on a trailing-twelve month (TTM) basis. Fears of Cisco’s demise in a new age of technology have long kept the stock undervalued. At its current price of ~$28/share, Cisco has a price to economic book value ( PEBV ) of 0.9. This ratio implies the market expects Cisco’s profits to permanently decline by 10%. However, if Cisco can grow NOPAT by 5% compounded annually over the next decade , the stock is worth $36/share – a 28% upside. Proofpoint Inc. (NASDAQ: PFPT ) is one of our least favorite stocks held by ARKW and earns our Dangerous rating. Proofpoint is similar to many of our recent Danger Zone picks in that it touts high revenue growth but negative profits. From 2012-2014, Proofpoint grew revenue by 23% compounded annually. On the other hand, NOPAT declined from -$19 million to -$47 million. On a TTM basis, which includes 1Q15 results, NOPAT has fallen to -$52 million. Proofpoint’s pre-tax (NOPBT) margins are -26% and the company currently earns a bottom-quintile ROIC of -53%. The stock price has benefited from the hype surrounding cyber security companies and is now significantly overvalued. To justify its current price of $63/share, Proofpoint must immediately achieve 6% NOPBT margins (similar to peer Fortinet (NASDAQ: FTNT )) and grow revenues by 30% compounded annually for the next 16 years . If you want to be in a stock that benefits from the growth in cyber security, we recommend this recent stock pick of the week. Figures 3 and 4 show the rating landscape of all Information Technology ETFs and mutual funds. Figure 3: Separating the Best ETFs From the Worst ETFs (click to enlarge) Sources: New Constructs, LLC and company filings Figure 4: Separating the Best Mutual Funds From the Worst Mutual Funds (click to enlarge) Sources: New Constructs, LLC and company filings D isclosure: David Trainer and Max Lee receive no compensation to write about any specific stock, sector or theme. Disclosure: I/we have no positions in any stocks mentioned, and no plans to initiate any positions within the next 72 hours. (More…) I wrote this article myself, and it expresses my own opinions. I am not receiving compensation for it. I have no business relationship with any company whose stock is mentioned in this article.
Strong Returns In Up Markets; Protection In Down Markets

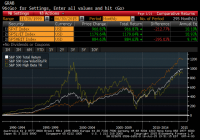
This series offers an expansive look at the Low Volatility Anomaly, or why lower-risk securities have historically produced stronger risk-adjusted returns than higher-risk securities or the broader market. This article shows in simple terms how a Low Volatility strategy would have done in both up and down markets. The downside protection in bear markets more than makes up for lagging returns in bull markets to generate higher risk-adjusted returns over time. Through this expansive series on Low Volatility Investing, I have tried to give readers a theoretical underpinning for why low volatility strategies have produced “alpha” historically while presenting empirical evidence across markets, geographies, and long time intervals. In this article, I am returning to the example of the S&P 500 Low Volatility Index (replicated by SPLV ). This index is comprised of the one-hundred constituents of the S&P 500 (NYSEARCA: SPY ) with the lowest realized volatility over the trailing one year, weighted by the inverse of their volatility, and rebalanced quarterly. As seen in the introductory article to this series and displayed again below, a low volatility factor tilt has produced higher absolute returns than the broader market or its high beta components (NYSEARCA: SPHB ) while producing its namesake lower volatility return profile. Source: Standard and Poor’s; Bloomberg Index information for the Low Volatility and High Beta Indices are back-tested, based on the methodology that was in effect on the launch date of the indices. While the higher risk-adjusted returns inherent in the Low Volatility strategy is visible in this cumulative return series, I though that it would be instructive for Seeking Alpha readers to see the annual returns of the Low Volatility strategy and S&P 500 broken down by up and down years for the broad market gauge. The historical returns of the two indices are tabled on the left. On the right, I have broken these return series into the four down years for the S&P 500 in this sample period and the up years for this broad market gauge. (click to enlarge) In up years for the broad market, the S&P 500 outperformed the S&P Low Volatility Index by 3.9% per year. However, in the down years for the broad market, the S&P 500 Low Volatility Index bested the broader market by 19.6% per year. It is this outperformance in down markets that has led to the long-run higher absolute returns for the S&P Low Volatility Index. Readers should note that the majority of the outperformance of the S&P 500 in up markets was in 1998 and 1999 when a tech-fueled S&P 500 outperformed the Low Volatility Index. The S&P 500 would produce negative returns over the subsequent three years. Some readers might posit that they will time when to pivot to Low Volatility stocks or even to zero volatility cash from the broader equity market, capturing higher returns during bull markets while crafting their own downside protection through good foresight. For practitioners with a more cloudy crystal ball, low volatility strategies may be a good buy-and-hold strategy for producing higher long-run risk-adjusted returns. In late 2014, I published Low Volatility Strategies in Bull Markets , which showed this Low Volatility gauge had captured all of the market performance over the previous five years. To outperform low volatility stocks, investors would have had to pivot quickly to riskier equity strategies very early in the market recovery in 2009. This is easier said than done, and a buy-and-hold low volatility strategy may be of value to many Seeking Alpha readers. For investors with a higher risk tolerance and an interest in capturing incremental returns from a tilt towards higher beta stocks, read tomorrow’s article on a switching strategy using low volatility stocks and momentum that has produced tremendous long-run alpha and is one of my favorite pieces in this series. Disclaimer My articles may contain statements and projections that are forward-looking in nature, and therefore, inherently subject to numerous risks, uncertainties and assumptions. While my articles focus on generating long-term risk-adjusted returns, investment decisions necessarily involve the risk of loss of principal. Individual investor circumstances vary significantly, and information gleaned from my articles should be applied to your own unique investment situation, objectives, risk tolerance, and investment horizon. Disclosure: I am/we are long SPLV, SPY. (More…) I wrote this article myself, and it expresses my own opinions. I am not receiving compensation for it (other than from Seeking Alpha). I have no business relationship with any company whose stock is mentioned in this article.